

signal strength 1 of 5
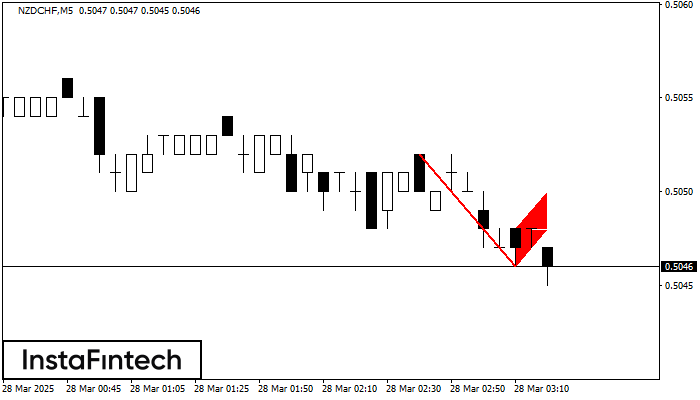
The Bearish Flag pattern has been formed on the chart NZDCHF M5. Therefore, the downwards trend is likely to continue in the nearest term. As soon as the price breaks below the low at 0.5046, traders should enter the market.
The M5 and M15 time frames may have more false entry points.
Xem thêm
- All
- Double Top
- Flag
- Head and Shoulders
- Pennant
- Rectangle
- Triangle
- Triple top
- All
- #AAPL
- #AMZN
- #Bitcoin
- #EBAY
- #FB
- #GOOG
- #INTC
- #KO
- #MA
- #MCD
- #MSFT
- #NTDOY
- #PEP
- #TSLA
- #TWTR
- AUDCAD
- AUDCHF
- AUDJPY
- AUDUSD
- EURCAD
- EURCHF
- EURGBP
- EURJPY
- EURNZD
- EURRUB
- EURUSD
- GBPAUD
- GBPCHF
- GBPJPY
- GBPUSD
- GOLD
- NZDCAD
- NZDCHF
- NZDJPY
- NZDUSD
- SILVER
- USDCAD
- USDCHF
- USDJPY
- USDRUB
- All
- M5
- M15
- M30
- H1
- D1
- All
- Buy
- Sale
- All
- 1
- 2
- 3
- 4
- 5
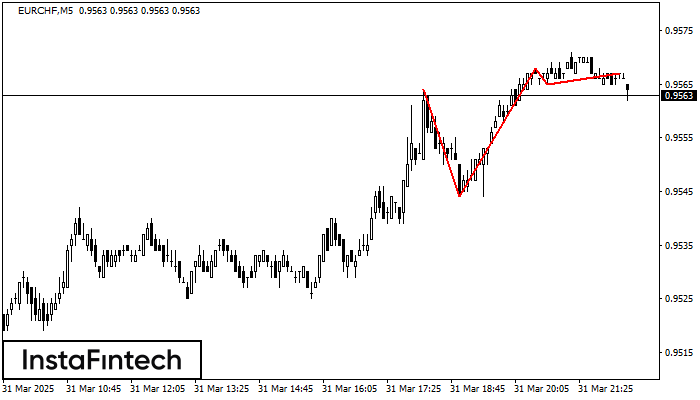
The Triple Top pattern has formed on the chart of the EURCHF M5 trading instrument. It is a reversal pattern featuring the following characteristics: resistance level -3, support level -21
The M5 and M15 time frames may have more false entry points.
Открыть график инструмента в новом окне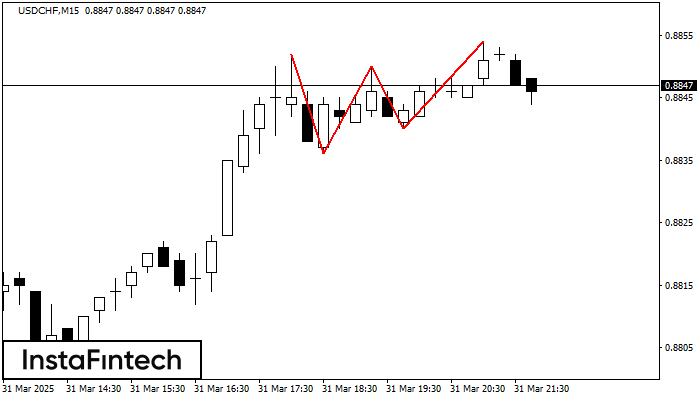
The Triple Top pattern has formed on the chart of the USDCHF M15 trading instrument. It is a reversal pattern featuring the following characteristics: resistance level -2, support level -4
The M5 and M15 time frames may have more false entry points.
Открыть график инструмента в новом окне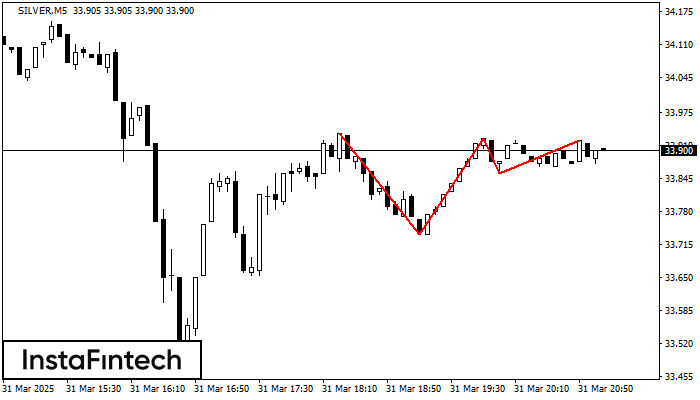
The Triple Top pattern has formed on the chart of the SILVER M5 trading instrument. It is a reversal pattern featuring the following characteristics: resistance level 15, support level -120
The M5 and M15 time frames may have more false entry points.
Открыть график инструмента в новом окне


