signal strength 3 of 5
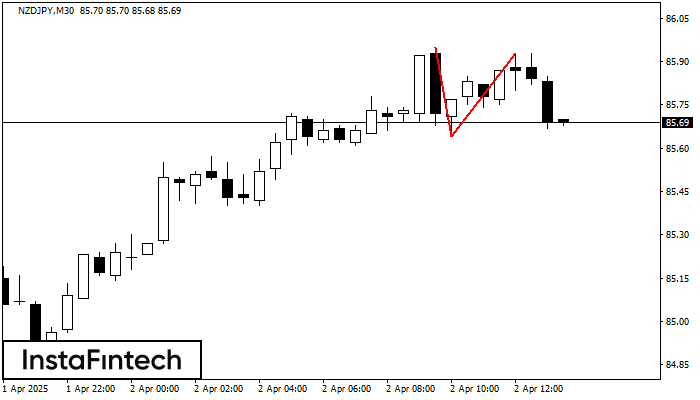
The Double Top reversal pattern has been formed on NZDJPY M30. Characteristics: the upper boundary 85.95; the lower boundary 85.64; the width of the pattern is 29 points. Sell trades are better to be opened below the lower boundary 85.64 with a possible movements towards the 85.34 level.
ดูเพิ่มเติม
- All
- Double Top
- Flag
- Head and Shoulders
- Pennant
- Rectangle
- Triangle
- Triple top
- All
- #AAPL
- #AMZN
- #Bitcoin
- #EBAY
- #FB
- #GOOG
- #INTC
- #KO
- #MA
- #MCD
- #MSFT
- #NTDOY
- #PEP
- #TSLA
- #TWTR
- AUDCAD
- AUDCHF
- AUDJPY
- AUDUSD
- EURCAD
- EURCHF
- EURGBP
- EURJPY
- EURNZD
- EURRUB
- EURUSD
- GBPAUD
- GBPCHF
- GBPJPY
- GBPUSD
- GOLD
- NZDCAD
- NZDCHF
- NZDJPY
- NZDUSD
- SILVER
- USDCAD
- USDCHF
- USDJPY
- USDRUB
- All
- M5
- M15
- M30
- H1
- D1
- All
- Buy
- Sale
- All
- 1
- 2
- 3
- 4
- 5
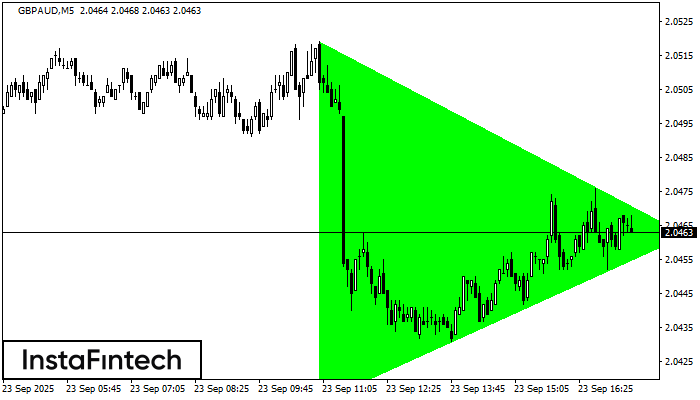
M5 के चार्ट के अनुसार, GBPAUD से बुलिश सिमेट्रिकल त्रिभुज पैटर्न बना। विवरण: यह एक ट्रेंड जारी रहने का पैटर्न है। 2.0519 और 2.0413 क्रमशः ऊपरी और निचली सीमाओं के
M5 और M15 समय सीमा में अधिक फाल्स एंट्री पॉइंट्स हो सकते हैं।
Open chart in a new window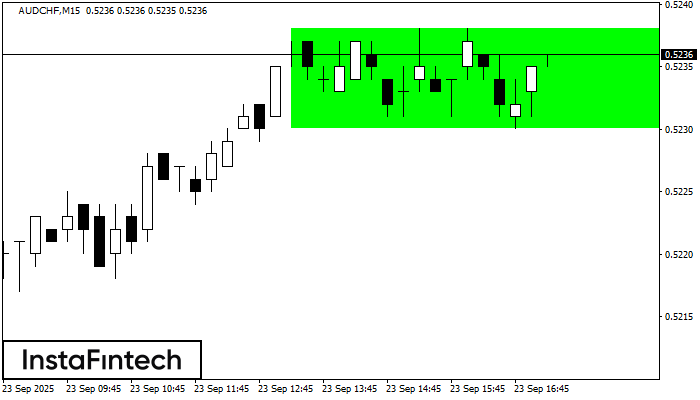
M15 के चार्ट के अनुसार, AUDCHF से बुलिश आयत बना। पैटर्न एक प्रवृत्ति निरंतरता को इंगित करता है। ऊपरी सीमा 0.5238 है, निचली सीमा 0.5230 है। सिग्नल का मतलब है
M5 और M15 समय सीमा में अधिक फाल्स एंट्री पॉइंट्स हो सकते हैं।
Open chart in a new window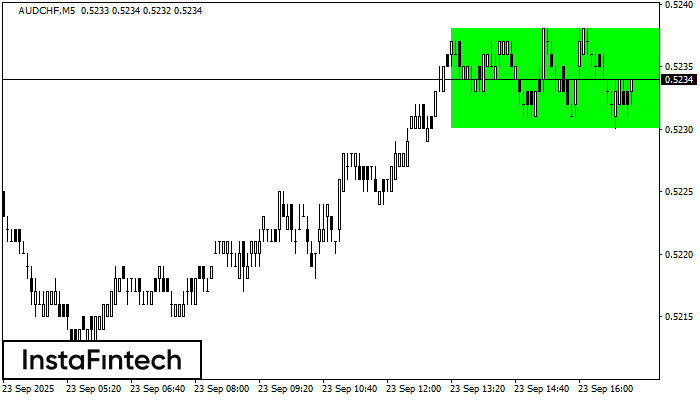
M5 के चार्ट के अनुसार, AUDCHF से बुलिश आयत बना। पैटर्न एक प्रवृत्ति निरंतरता को इंगित करता है। ऊपरी सीमा 0.5238 है, निचली सीमा 0.5230 है। सिग्नल का मतलब है
M5 और M15 समय सीमा में अधिक फाल्स एंट्री पॉइंट्स हो सकते हैं।
Open chart in a new window