signal strength 1 of 5

According to the chart of M5, NZDCAD formed the Inverse Head and Shoulder pattern. The Head’s top is set at 0.7878 while the median line of the Neck is found at 0.7826/0.7858. The formation of the Inverse Head and Shoulder pattern evidently signals a reversal of the downward trend. In other words, in case the scenario comes true, the price of NZDCAD will go towards 0.7893
The M5 and M15 time frames may have more false entry points.
Vea asimismo
- All
- Double Top
- Flag
- Head and Shoulders
- Pennant
- Rectangle
- Triangle
- Triple top
- All
- #AAPL
- #AMZN
- #Bitcoin
- #EBAY
- #FB
- #GOOG
- #INTC
- #KO
- #MA
- #MCD
- #MSFT
- #NTDOY
- #PEP
- #TSLA
- #TWTR
- AUDCAD
- AUDCHF
- AUDJPY
- AUDUSD
- EURCAD
- EURCHF
- EURGBP
- EURJPY
- EURNZD
- EURRUB
- EURUSD
- GBPAUD
- GBPCHF
- GBPJPY
- GBPUSD
- GOLD
- NZDCAD
- NZDCHF
- NZDJPY
- NZDUSD
- SILVER
- USDCAD
- USDCHF
- USDJPY
- USDRUB
- All
- M5
- M15
- M30
- H1
- D1
- All
- Buy
- Sale
- All
- 1
- 2
- 3
- 4
- 5
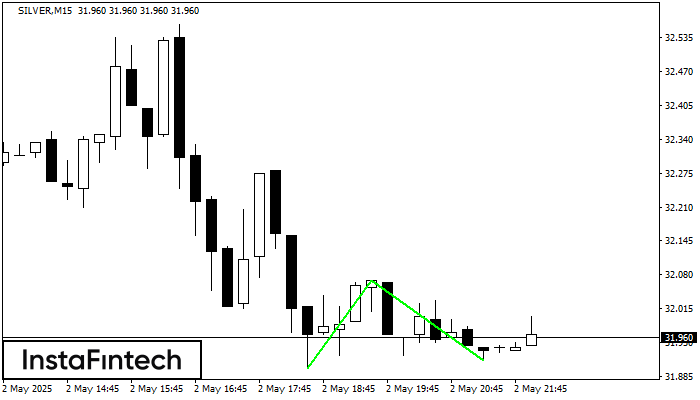
El patrón Doble Piso ha sido formado en SILVER M15. Características: el nivel de soporte 31.90; el nivel de resistencia 32.07; el ancho del patrón 170 puntos. Si el nivel
Los marcos de tiempo M5 y M15 pueden tener más puntos de entrada falsos.
Open chart in a new window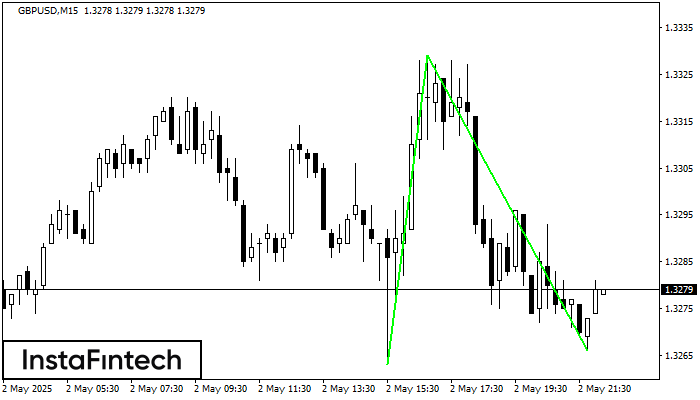
El patrón Doble Piso ha sido formado en GBPUSD M15. Características: el nivel de soporte 1.3263; el nivel de resistencia 1.3329; el ancho del patrón 66 puntos. Si el nivel
Los marcos de tiempo M5 y M15 pueden tener más puntos de entrada falsos.
Open chart in a new window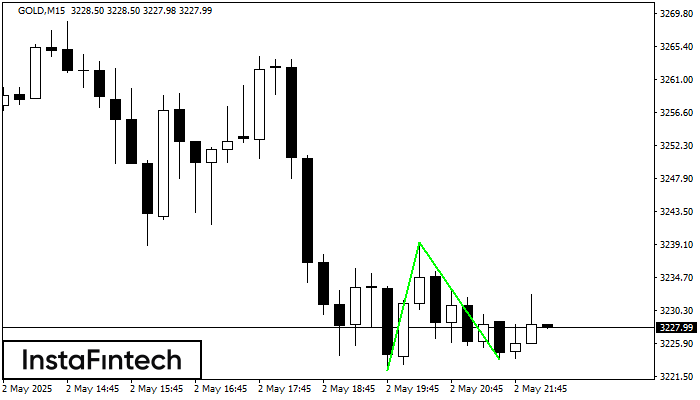
El patrón Doble Piso ha sido formado en GOLD M15. Esta formación señala una reversión de la tendencia de bajista a alcista. La señal es que se debe abrir
Los marcos de tiempo M5 y M15 pueden tener más puntos de entrada falsos.
Open chart in a new window