signal strength 2 of 5
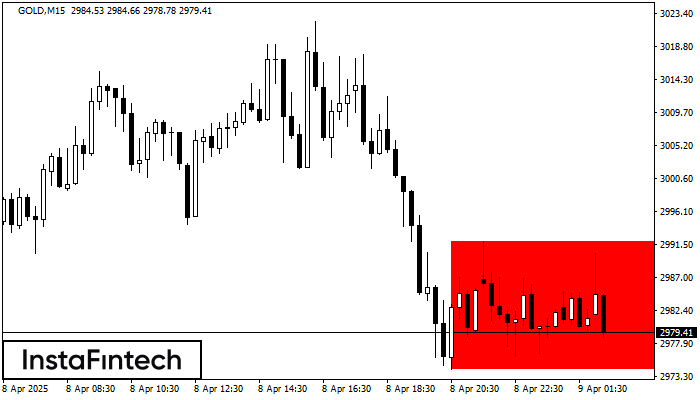
According to the chart of M15, GOLD formed the Bearish Rectangle. This type of a pattern indicates a trend continuation. It consists of two levels: resistance 2991.89 - 0.00 and support 2974.26 – 2974.26. In case the resistance level 2974.26 - 2974.26 is broken, the instrument is likely to follow the bearish trend.
The M5 and M15 time frames may have more false entry points.
Vea asimismo
- All
- Double Top
- Flag
- Head and Shoulders
- Pennant
- Rectangle
- Triangle
- Triple top
- All
- #AAPL
- #AMZN
- #Bitcoin
- #EBAY
- #FB
- #GOOG
- #INTC
- #KO
- #MA
- #MCD
- #MSFT
- #NTDOY
- #PEP
- #TSLA
- #TWTR
- AUDCAD
- AUDCHF
- AUDJPY
- AUDUSD
- EURCAD
- EURCHF
- EURGBP
- EURJPY
- EURNZD
- EURRUB
- EURUSD
- GBPAUD
- GBPCHF
- GBPJPY
- GBPUSD
- GOLD
- NZDCAD
- NZDCHF
- NZDJPY
- NZDUSD
- SILVER
- USDCAD
- USDCHF
- USDJPY
- USDRUB
- All
- M5
- M15
- M30
- H1
- D1
- All
- Buy
- Sale
- All
- 1
- 2
- 3
- 4
- 5
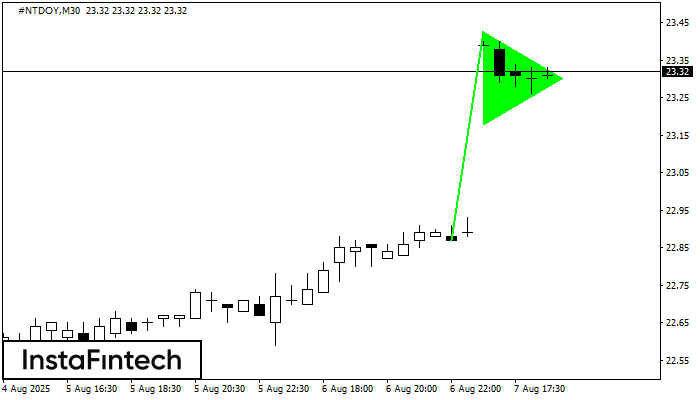
El patrón Banderín alcista está formado en el gráfico #NTDOY M30. Este es un tipo de patrón de continuación. Supuestamente, en caso de que el precio se fije por encima
Open chart in a new window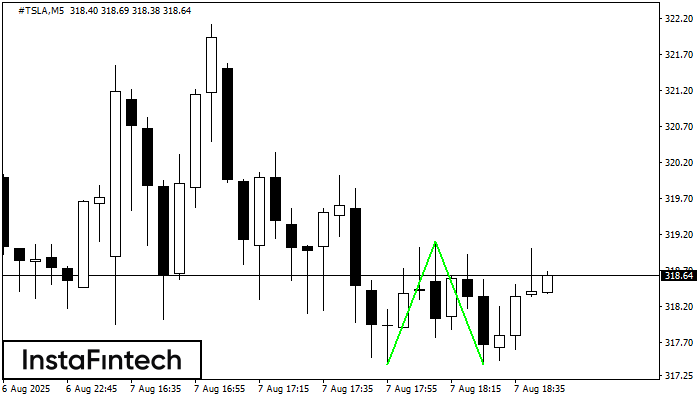
El patrón Doble Piso ha sido formado en #TSLA M5. Esta formación señala una reversión de la tendencia de bajista a alcista. La señal es que se debe abrir
Los marcos de tiempo M5 y M15 pueden tener más puntos de entrada falsos.
Open chart in a new window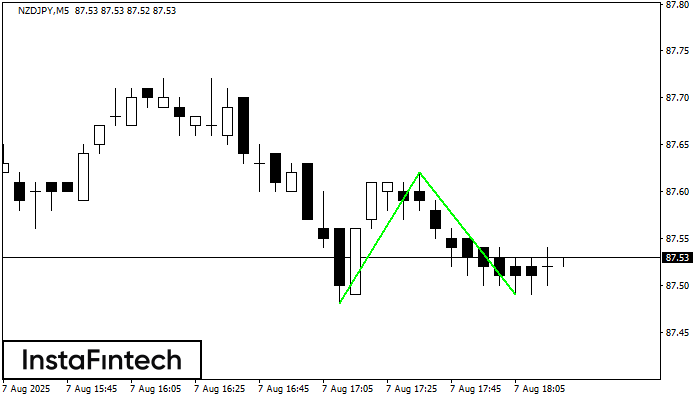
El patrón Doble Piso ha sido formado en NZDJPY M5. Características: el nivel de soporte 87.48; el nivel de resistencia 87.62; el ancho del patrón 14 puntos. Si el nivel
Los marcos de tiempo M5 y M15 pueden tener más puntos de entrada falsos.
Open chart in a new window