GBP/USD
Analysis:
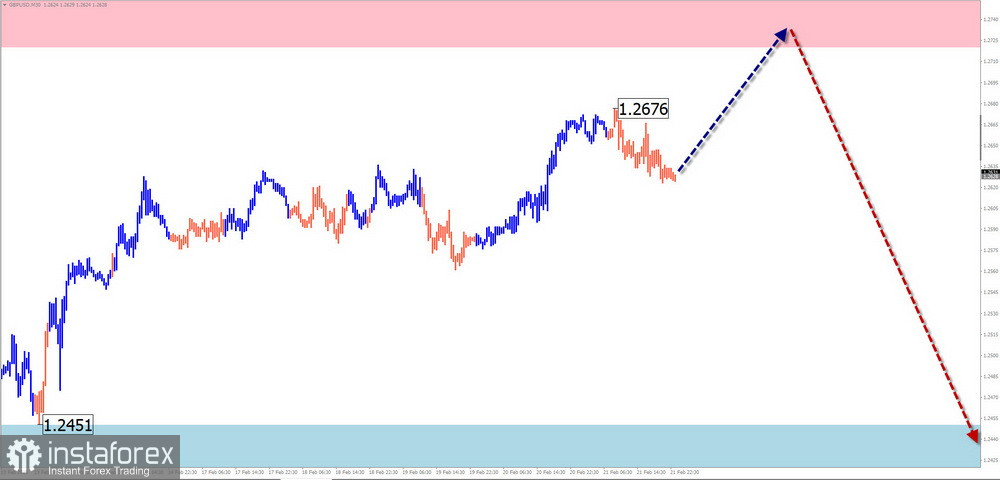
Over the past six months, GBP/USD has been following a downtrend. Since mid-January, the price has been forming a counter-wave with reversal potential from a strong support zone. The final phase of this wave is currently unfolding, nearing a major reversal area.
Forecast:
At the start of the week, the bullish sentiment on the pound is likely to continue, driving the price toward the resistance zone. A sideways movement and potential reversal may follow. A trend shift and price decline are expected by the end of the week.
Potential Reversal Zones:
- Resistance: 1.2720 – 1.2770
- Support: 1.2450 – 1.2400
Trading Recommendations:
- Buying is possible in small volume sizes for intraday trading, but only until reversal signals appear.
- Selling should be considered only after confirmed reversal signals near resistance.
AUD/USD
Analysis:
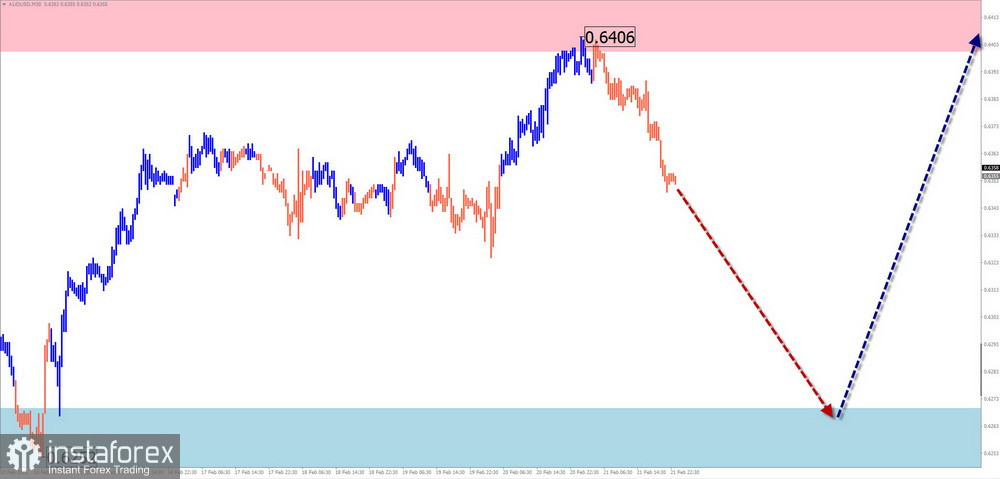
The bullish wave structure on AUD/USD, which began on February 3, has been undergoing a correction over the past 10 days. The current movement resembles a shifting flat pattern, which remains incomplete. The price has bounced off a major reversal zone on the higher timeframe.
Forecast:
During the first half of the week, the price is expected to decline toward the support zone, with the possibility of briefly breaking below it. Toward the end of the week, a resumption of price growth toward the resistance level is likely.
Potential Reversal Zones:
- Resistance: 0.6400 – 0.6450
- Support: 0.6270 – 0.6220
Trading Recommendations:
- Selling may become the main strategy after confirmation signals appear near resistance.
- Buying is possible in small volumes within specific trading sessions.
USD/CHF
Analysis:
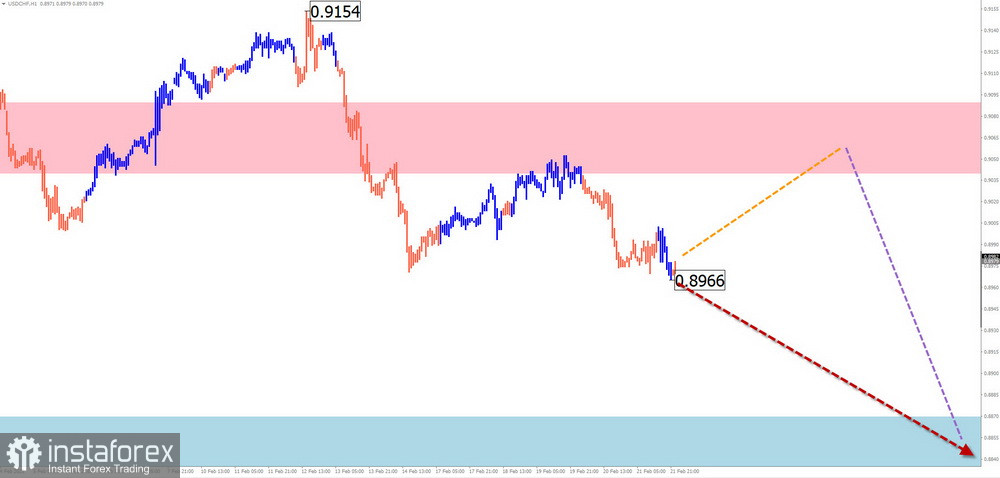
Since the beginning of the year, USD/CHF has been following a downward wave pattern, with the final phase yet to be completed. The price is now approaching a key reversal zone on the daily timeframe.
Forecast:
During the first half of the week, an upward movement is expected. A reversal and renewed downtrend could form near the resistance area, with a potential decline toward the end of the week.
Potential Reversal Zones:
- Resistance: 0.9040 – 0.9090
- Support: 0.8870 – 0.8820
Trading Recommendations:
- Buying is possible in small volumes within individual trading sessions.
- Selling is advisable only after confirmed reversal signals appear near resistance.
EUR/JPY
Analysis:
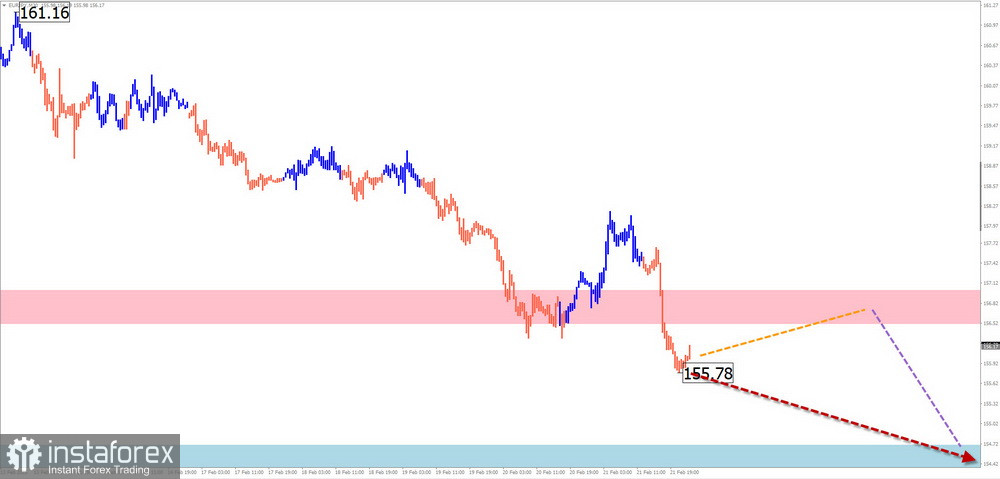
Since December, EUR/JPY has been following a downtrend. The wave is now forming its final phase (C), with the price having broken through intermediate support, which has now turned into resistance.
Forecast:
The pair is expected to continue its downward trajectory throughout the week. A temporary pullback toward resistance is possible early in the week, followed by a resumption of the downtrend in the second half of the week. The lower boundary of the expected price range is marked by the projected support level.
Potential Reversal Zones:
- Resistance: 156.50 – 157.00
- Support: 154.70 – 154.20
Trading Recommendations:
- Buying is risky due to limited upward potential.
- Selling becomes an attractive option once reversal signals appear near resistance.
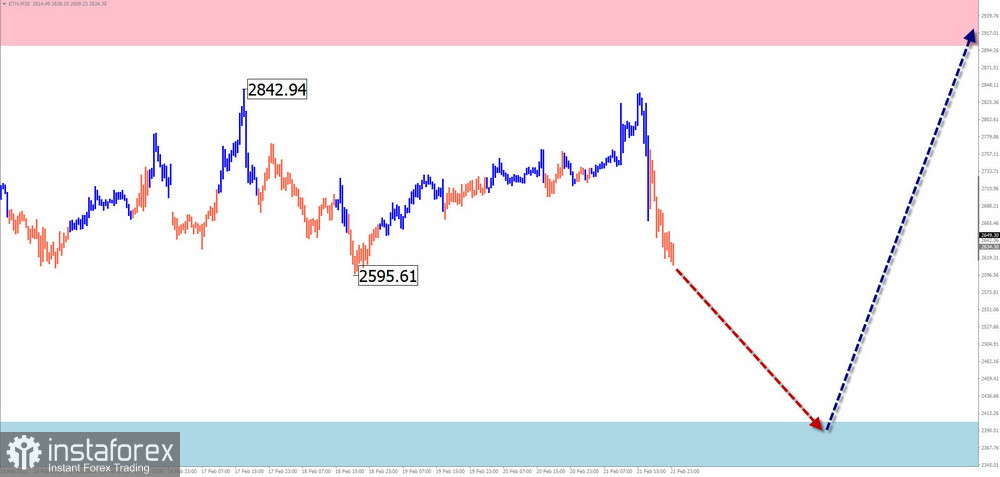
Ethereum (ETH/USD)
Analysis:
Ethereum has been forming a long-term uptrend for the past six months. Since November, it has been undergoing a prolonged correction, forming a broadening flat structure that remains incomplete. The price is now approaching a key reversal zone on a higher timeframe.
Forecast:
In the coming days, Ethereum is expected to continue its downward movement toward support. After testing the lower boundary, a sideways consolidation (flat market) and potential reversal could follow. A renewed bullish move is more likely by the end of the week.
Potential Reversal Zones:
- Resistance: 2900 – 3000
- Support: 2400 – 2300
Trading Recommendations:
- Selling is possible in small volume sizes for intraday trading, but gains may be limited near support.
- Buying should be considered only after confirmed reversal signals appear near support.
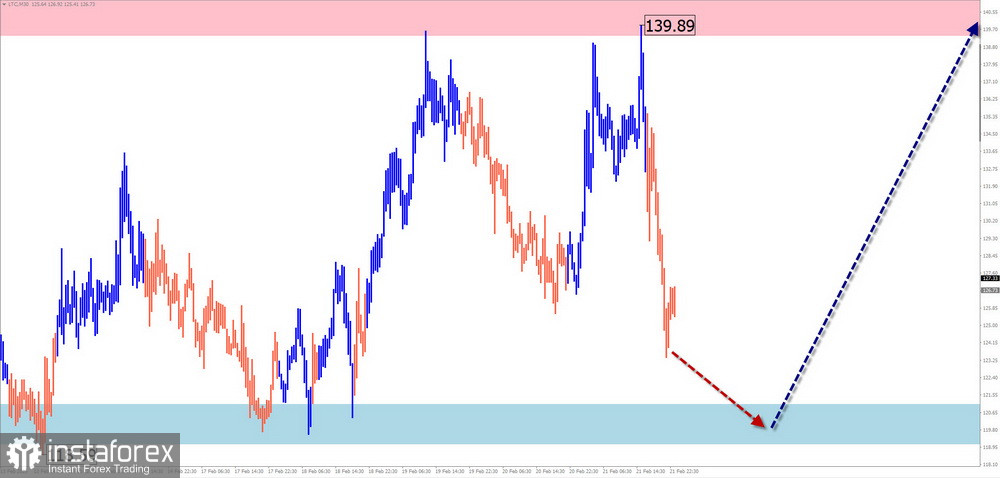
Litecoin (LTC/USD)
Analysis:
Since early February, Litecoin has been forming an unfinished bullish wave, with the potential to become the start of a new long-term uptrend. Over the past week, the price has been undergoing a correction, forming a shifting flat structure.
Forecast:
During the week, sideways movement is expected within a calculated counter-trend range. A bearish movement is more likely in the first half of the week, followed by a potential reversal near support. Litecoin is expected to resume growth either by the end of the week or early next week.
Potential Reversal Zones:
- Resistance: 139.40 – 140.40
- Support: 121.20 – 120.20
Trading Recommendations:
- Buying is premature until confirmed reversal signals appear near support.
- Selling is possible in small volume sizes within individual sessions.
Explanation of Simplified Wave Analysis (SWA):
- All waves consist of three parts (A-B-C).
- Each timeframe analyzes the most recent incomplete wave.
- Dashed lines indicate expected price movements.
Note: The wave algorithm does not account for time duration in market movements.