signal strength 1 of 5

According to the chart of M5, AUDCAD formed the Bullish Symmetrical Triangle pattern, which signals the trend will continue. Description. The upper border of the pattern touches the coordinates 0.8838/0.8828 whereas the lower border goes across 0.8815/0.8828. The pattern width is measured on the chart at 23 pips. If the Bullish Symmetrical Triangle pattern is in progress during the upward trend, this indicates the current trend will go on. In case 0.8828 is broken, the price could continue its move toward 0.8843.
The M5 and M15 time frames may have more false entry points.
See Also
- All
- Double Top
- Flag
- Head and Shoulders
- Pennant
- Rectangle
- Triangle
- Triple top
- All
- #AAPL
- #AMZN
- #Bitcoin
- #EBAY
- #FB
- #GOOG
- #INTC
- #KO
- #MA
- #MCD
- #MSFT
- #NTDOY
- #PEP
- #TSLA
- #TWTR
- AUDCAD
- AUDCHF
- AUDJPY
- AUDUSD
- EURCAD
- EURCHF
- EURGBP
- EURJPY
- EURNZD
- EURRUB
- EURUSD
- GBPAUD
- GBPCHF
- GBPJPY
- GBPUSD
- GOLD
- NZDCAD
- NZDCHF
- NZDJPY
- NZDUSD
- SILVER
- USDCAD
- USDCHF
- USDJPY
- USDRUB
- All
- M5
- M15
- M30
- H1
- D1
- All
- Buy
- Sale
- All
- 1
- 2
- 3
- 4
- 5
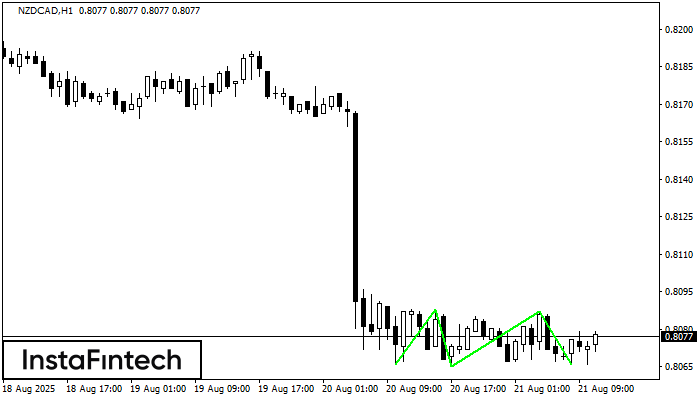
Mô hình Đáy ba đã được hình thành trên biểu đồ của công cụ giao dịch NZDCAD H1. Mô hình này báo hiệu một sự thay đổi trong xu hướng
Open chart in a new window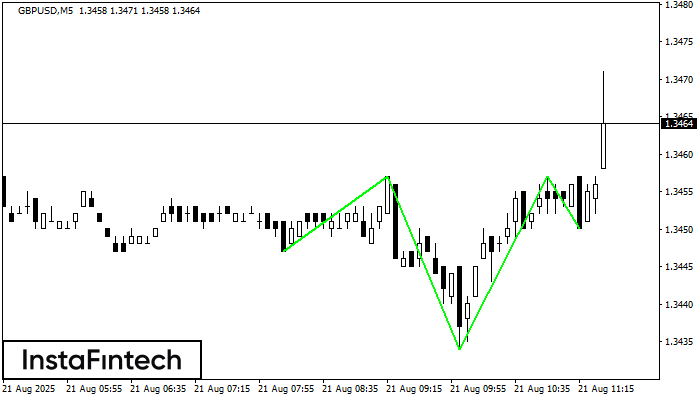
Theo biểu đồ của M5, GBPUSD đã hình thành mô hình Đảo đầu và vai. Đỉnh của Đầu được đặt ở 1.3457 trong khi đường trung bình của Cổ được
Khung thời gian M5 và M15 có thể có nhiều điểm vào lệnh sai hơn.
Open chart in a new window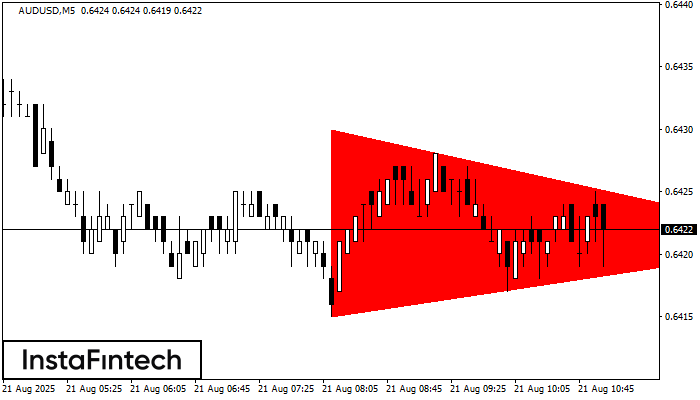
Theo biểu đồ của M5, AUDUSD đã hình thành mô hình Tam giác Cân Giảm. Khuyến nghị giao dịch: Việc vi phạm biên giới thấp hơn 0.6415 có khả năng
Khung thời gian M5 và M15 có thể có nhiều điểm vào lệnh sai hơn.
Open chart in a new window