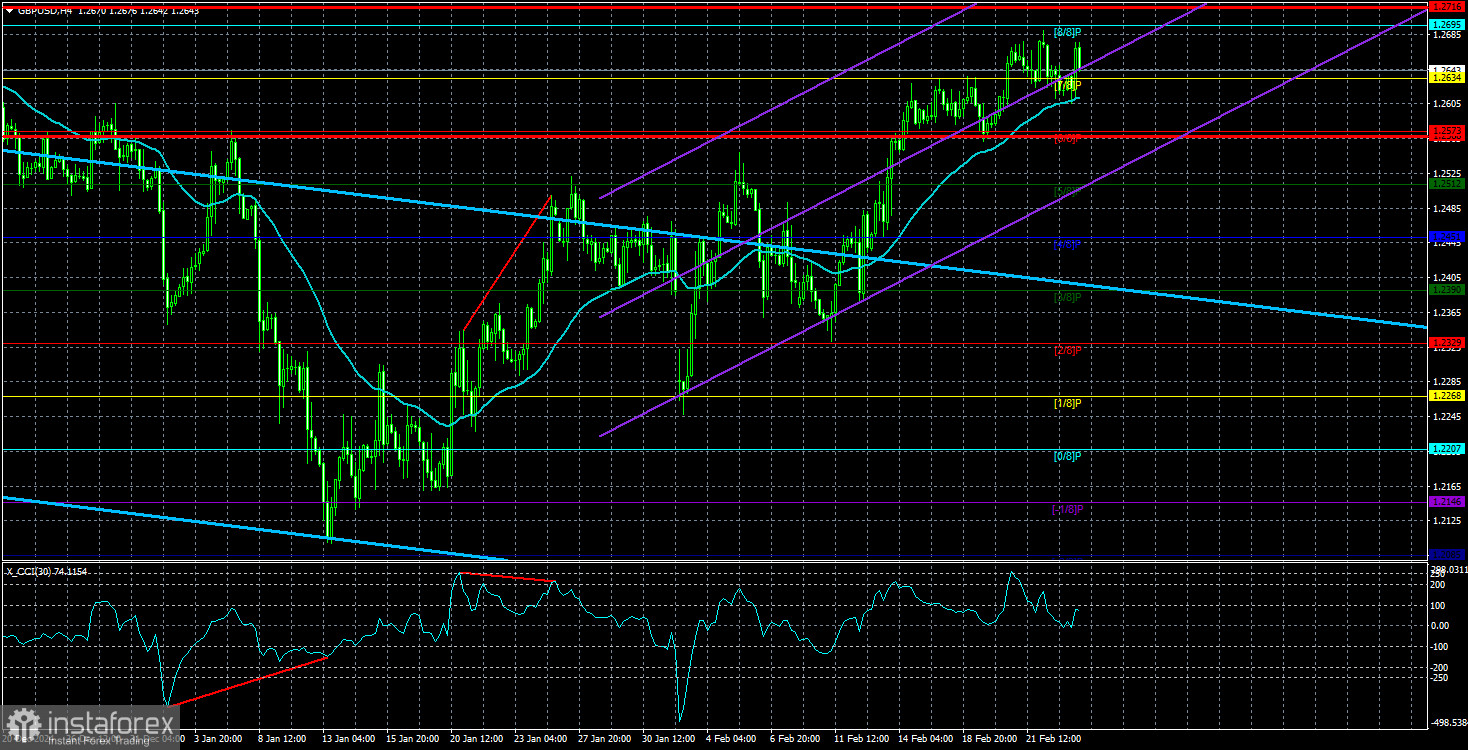
On Tuesday, the GBP/USD currency pair rebounded from the moving average line and began to rise again. It's worth noting that there were no significant fundamental reasons for this increase in the British currency. However, the recent strengthening of the pound can be explained for several reasons. First, the technical analysis indicated a correction was necessary on the daily timeframe. Second, the latest macroeconomic reports from the UK, although only slightly, showed positive trends for the pound. Finally, it is anticipated that the Bank of England will adopt a stricter stance on monetary easing in 2025.
At the same time, the pound has already risen significantly. In the 4-hour timeframe, it's clear that the latest upward movement is narrowing toward its peak, which often signals the end of a trend. However, not everything follows technical patterns perfectly. We do not rule out the possibility that after the current upward movement ends, the pound will see only a slight downward correction before resuming its ascent. However, there is no solid justification for another 400-500 pip rally. Yes, the Bank of England may lower rates only two or three times instead of four in 2025. Yes, recent macroeconomic data has been somewhat optimistic. But none of this supports the idea of an overall 700-800 pip surge. Market movements should correspond to the strength of the macroeconomic and fundamental backdrop.
The Q4 GDP report exceeded market expectations, showing a mere +0.1% growth. Does a 0.1% economic expansion justify the pound's strong rally? UK inflation has risen to 3%—so what? Inflation in the US is also at 3%. The Bank of England may cut rates fewer times in 2025, but the Federal Reserve may only lower rates once or not at all. Trump's tariffs will fuel inflation not just in Europe but also in the US itself. So, while the pound has had some minor reasons for optimism, these are not enough to justify the formation of a new uptrend, even in the 4-hour timeframe.
Examining the daily timeframe, it is clearly visible that within the framework of the current correction, the pound has yet to reach its most recent local high, despite experiencing a rise over the past month and a half. We do not expect the GBP/USD pair to exceed 1.2800, where this high is situated. However, even if the price reaches 1.2800, it does not indicate an immediate return to the long-term downtrend that has persisted for six months. The overall correction could be more complex. If you are trading during this correction, it is advisable to focus on lower timeframes; even the 4-hour chart does not currently appear particularly appealing. To trade confidently on the 4-hour timeframe, we need to see the conclusion of the upward correction on the daily chart.
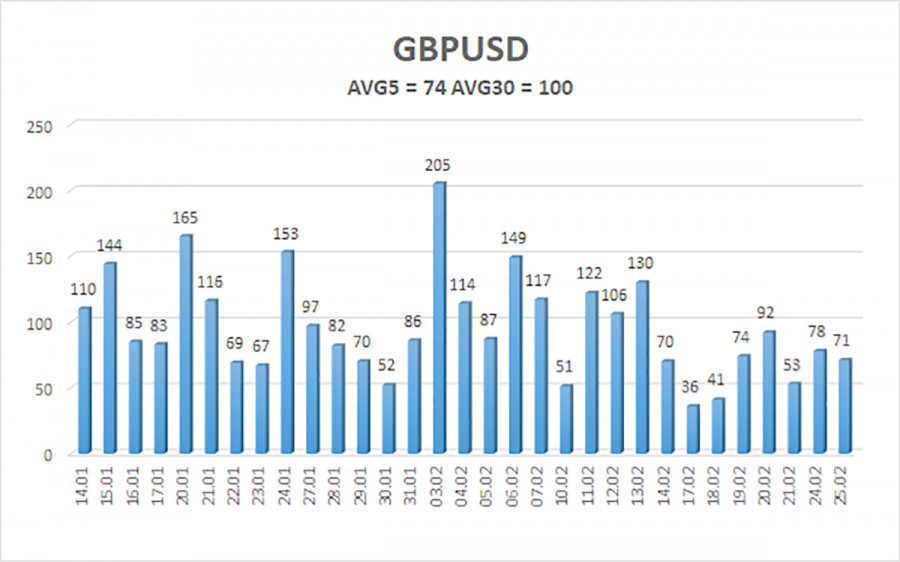
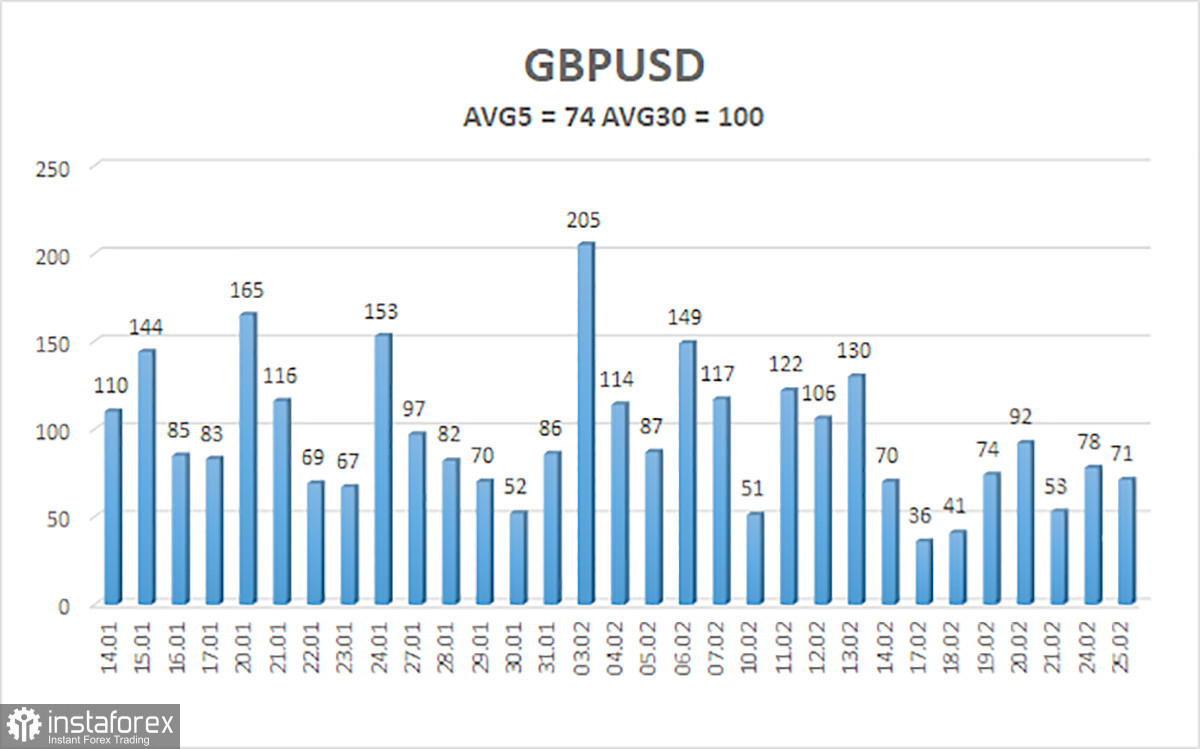
The average volatility of the GBP/USD pair over the last five trading days is 74 pips, which is classified as "moderate" for this pair. On Tuesday, February 25, we expect movement between 1.2568 and 1.2716. The long-term regression channel remains downward, signaling a bearish trend. The CCI indicator entered the overbought zone on Friday, suggesting a new decline may be imminent.
Nearest Support Levels:
S1 – 1.2634
S2 – 1.2573
S3 – 1.2512
Nearest Resistance Levels:
R1 – 1.2695
R2 – 1.2756
R3 – 1.2817
Trading Recommendations:
The GBP/USD pair maintains a medium-term downtrend. Long positions are still not advisable, as the current upward movement is viewed as a correction. If you trade purely on technicals, long positions are possible with targets at 1.2695 and 1.2716 if the price remains above the moving average. However, sell orders remain more relevant, targeting 1.2207 and 1.2146, as the upward correction on the daily timeframe will eventually end. For short positions, a consolidation below the moving average is necessary. The pound already appears overbought in the short term.
Explanation of Illustrations:
Linear Regression Channels help determine the current trend. If both channels are aligned, it indicates a strong trend.
Moving Average Line (settings: 20,0, smoothed) defines the short-term trend and guides the trading direction.
Murray Levels act as target levels for movements and corrections.
Volatility Levels (red lines) represent the likely price range for the pair over the next 24 hours based on current volatility readings.
CCI Indicator: If it enters the oversold region (below -250) or overbought region (above +250), it signals an impending trend reversal in the opposite direction.