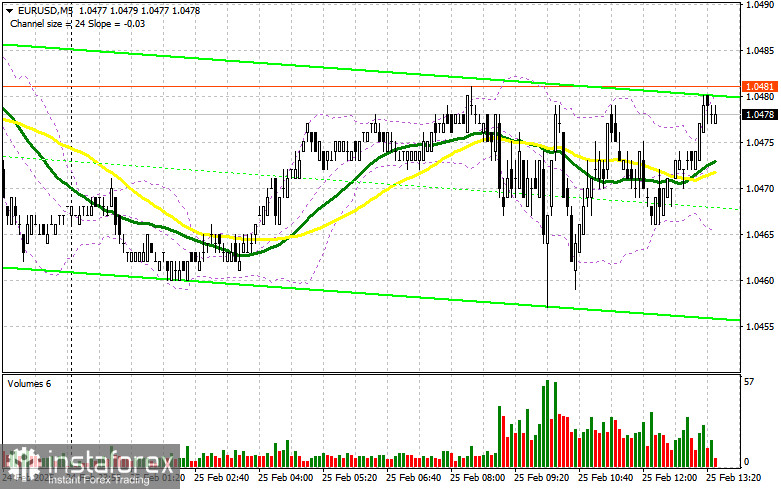
In my morning forecast, I focused on the 1.0445 level as a key point for making trading decisions. Looking at the 5-minute chart, we can see that while the price did decline, it failed to form a suitable entry point, and due to market volatility within a 20-point range, I remained without trades. Given this, the technical outlook for the second half of the day has been revised.
Considering the market's low volatility and the fact that Germany's GDP data met economists' expectations, the euro still has a chance for recovery in the second half of the day. The upcoming U.S. economic reports could reignite demand for the euro, but only if the data disappoints. Key figures to watch include the S&P/Case-Shiller Home Price Index and the Richmond Fed Manufacturing Index. Additionally, speeches from FOMC members Michael S. Barr and Thomas Barkin are scheduled, which could provide insights into the future of monetary policy. A dovish stance from policymakers would be a reason to continue buying the euro.
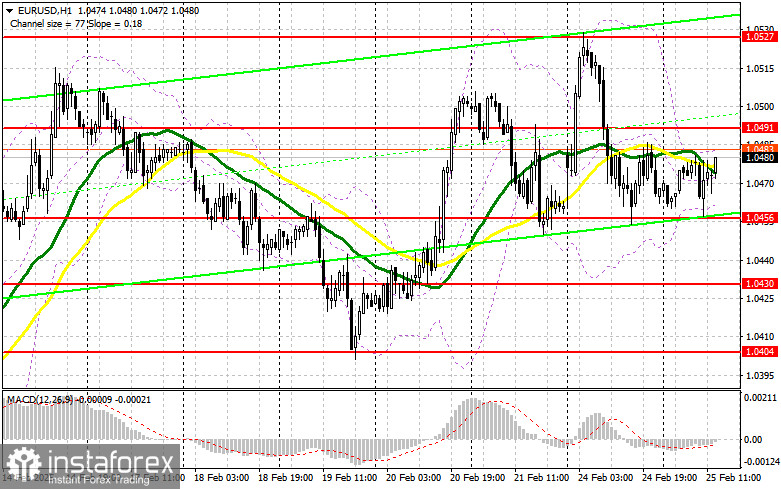
If downward pressure on the euro returns during the U.S. session, I will look at 1.0456, the support level formed earlier in the day, for a potential buying opportunity. A false breakout at this level could create a good entry point for an upward move towards 1.0491. A breakout and retest of this range would confirm a valid long entry with an extended target at 1.0527. The furthest target remains at 1.0564, where I will look to lock in profits.
If EUR/USD declines further and buyers show no activity around 1.0456, bullish sentiment will fade, allowing sellers to push the price down to 1.0430. A false breakout at this level would provide another opportunity to buy the euro. If there's an extended decline, I will consider long positions from 1.0404, targeting an intraday rebound of 30–35 points.
Short Position Strategy for EUR/USD:
With no new positive developments, sellers attempted to push the local low, but their efforts fell short. If the pair rises in the second half of the day, I will focus on defending 1.0491, as a failure to hold this level would allow the bullish market to regain strength. Sellers must establish a false breakout at this level to confirm short positions, targeting 1.0456 as the first support.
A break and retest of this range from below would be a strong selling signal, potentially driving the pair towards 1.0430 and ending any short-term bullish momentum. The final target for short positions will be 1.0404, where I will take profits.
If EUR/USD rises further without bearish activity around 1.0491, buyers could push for a stronger rally. In this case, I will wait for a test of 1.0527 before selling, provided a failed breakout confirms resistance. If there's no downward movement from this level, I will look for short entries around 1.0564, aiming for an intraday decline of 30–35 points.
Commitments of Traders (COT) Report
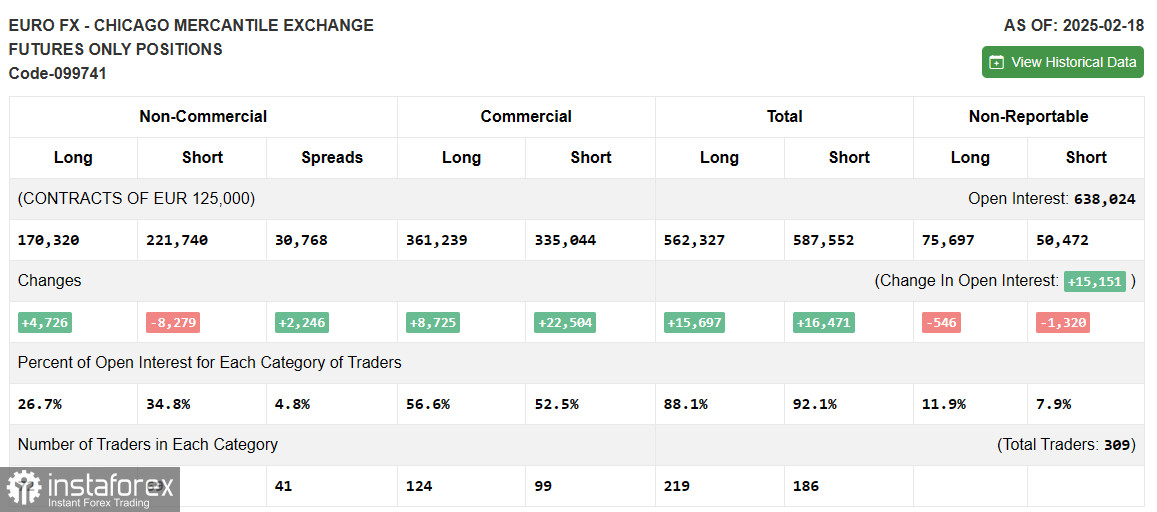
The COT report from February 18 showed an increase in long positions and a sharp reduction in short positions. The number of traders willing to buy euros has risen, mainly due to negotiations between the U.S. and Russia regarding the Ukraine conflict. The prospect of an end to hostilities in the coming months has boosted demand for risk assets, allowing the euro to perform well despite ongoing economic concerns.
However, sellers still hold an advantage, so caution is needed when buying at higher price levels. The COT report showed an increase in non-commercial long positions by 4,726, bringing the total to 170,320. Meanwhile, short positions decreased by 8,279, bringing them to 221,740. This narrowed the gap between longs and shorts by 2,246, signaling a potential shift in market sentiment.
Indicator Signals:
Moving Averages
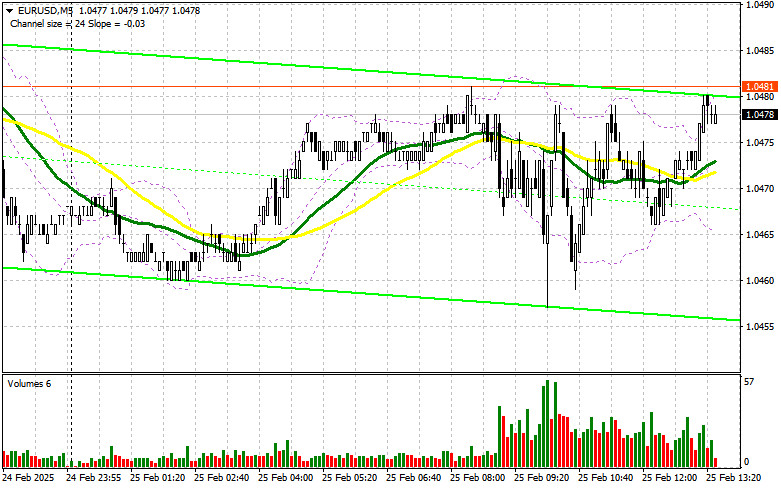
Trading is currently taking place around the 30 and 50-day moving averages, indicating market uncertainty.
Note: The periods and prices of moving averages used in this analysis are based on the H1 hourly chart, which differs from the standard definition of daily moving averages (D1 chart).
Bollinger Bands
In the event of a decline, the lower boundary of the Bollinger Bands around 1.0456 will act as support.
Indicator Descriptions:
- Moving Average (MA): Determines the current trend by smoothing out market volatility and noise.
- 50-period MA (marked in yellow on the chart).
- 30-period MA (marked in green on the chart).
- MACD (Moving Average Convergence/Divergence): Measures trend strength and potential reversals.
- Fast EMA: 12-period.
- Slow EMA: 26-period.
- Signal SMA: 9-period.
- Bollinger Bands: A volatility-based indicator that helps identify overbought and oversold conditions.
- Non-commercial traders: These include speculators, hedge funds, and large institutions that use the futures market for speculative purposes and meet specific requirements.
- Long non-commercial positions: The total number of open buy positions held by speculators.
- Short non-commercial positions: The total number of open sell positions held by speculators.
- Total non-commercial net position: The difference between the total long and short positions of non-commercial traders.