signal strength 3 of 5
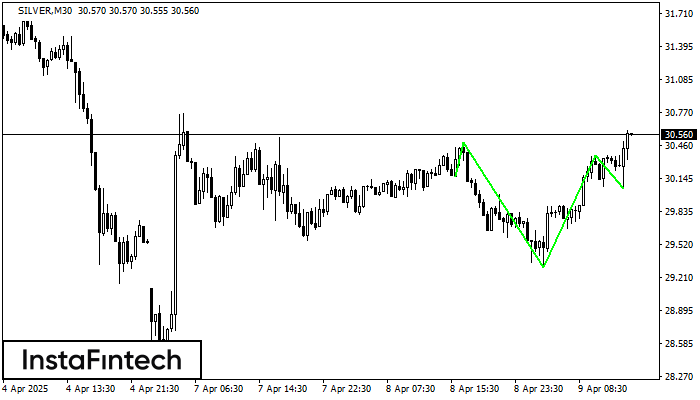
According to the chart of M30, SILVER formed the Inverse Head and Shoulder pattern. The Head’s top is set at 30.37 while the median line of the Neck is found at 29.30/30.05. The formation of the Inverse Head and Shoulder pattern evidently signals a reversal of the downward trend. In other words, in case the scenario comes true, the price of SILVER will go towards 30.40
See Also
- All
- Double Top
- Flag
- Head and Shoulders
- Pennant
- Rectangle
- Triangle
- Triple top
- All
- #AAPL
- #AMZN
- #Bitcoin
- #EBAY
- #FB
- #GOOG
- #INTC
- #KO
- #MA
- #MCD
- #MSFT
- #NTDOY
- #PEP
- #TSLA
- #TWTR
- AUDCAD
- AUDCHF
- AUDJPY
- AUDUSD
- EURCAD
- EURCHF
- EURGBP
- EURJPY
- EURNZD
- EURRUB
- EURUSD
- GBPAUD
- GBPCHF
- GBPJPY
- GBPUSD
- GOLD
- NZDCAD
- NZDCHF
- NZDJPY
- NZDUSD
- SILVER
- USDCAD
- USDCHF
- USDJPY
- USDRUB
- All
- M5
- M15
- M30
- H1
- D1
- All
- Buy
- Sale
- All
- 1
- 2
- 3
- 4
- 5
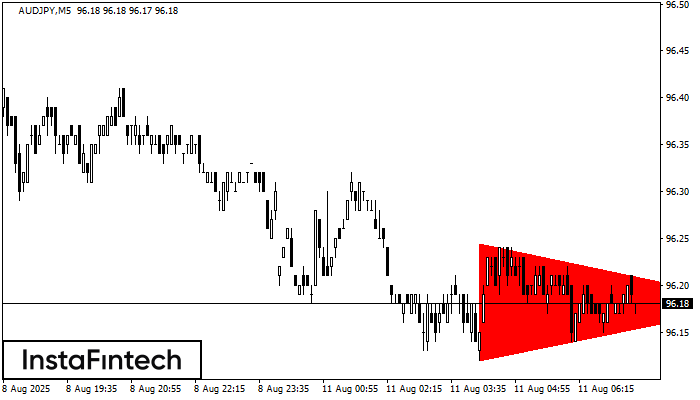
Según el gráfico de M5, el AUDJPY formó el patrón Triángulo Simétrico Bajista. Descripción: El límite inferior es 96.12/96.18 y el límite superior es 96.24/96.18. El ancho del patrón
Los marcos de tiempo M5 y M15 pueden tener más puntos de entrada falsos.
Open chart in a new window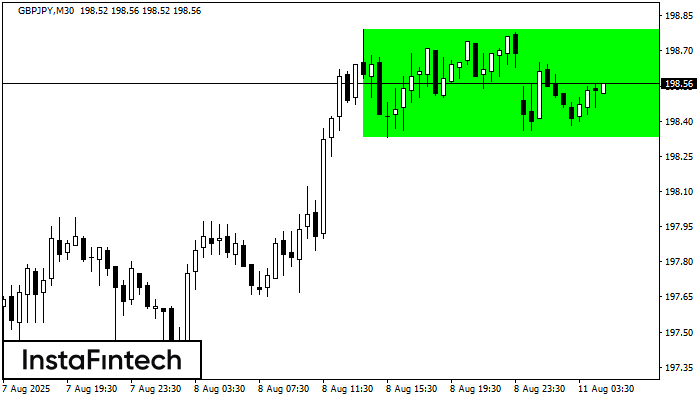
Según el gráfico de M30, GBPJPY formó el Rectángulo Alcista. El patrón indica la continuación de una tendencia. El límite superior es 198.79, el límite inferior es 198.33. La señal
Open chart in a new window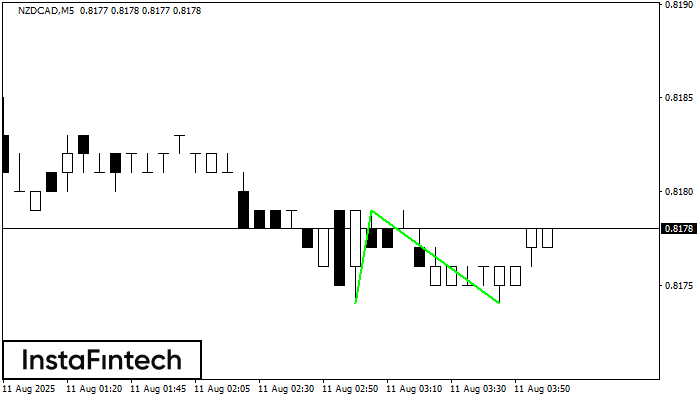
El patrón Doble Piso ha sido formado en NZDCAD M5. Esta formación señala una reversión de la tendencia de bajista a alcista. La señal es que se debe abrir
Los marcos de tiempo M5 y M15 pueden tener más puntos de entrada falsos.
Open chart in a new window