signal strength 1 of 5
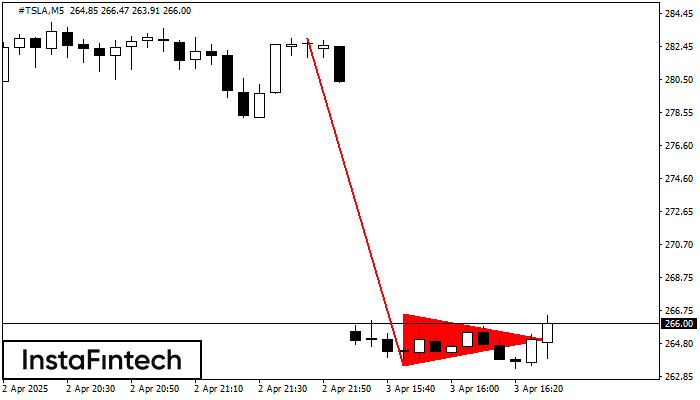
The Bearish pennant pattern has formed on the #TSLA M5 chart. This pattern type is characterized by a slight slowdown after which the price will move in the direction of the original trend. In case the price fixes below the pattern’s low of 263.52, a trader will be able to successfully enter the sell position.
The M5 and M15 time frames may have more false entry points.
Lihat juga
- All
- Double Top
- Flag
- Head and Shoulders
- Pennant
- Rectangle
- Triangle
- Triple top
- All
- #AAPL
- #AMZN
- #Bitcoin
- #EBAY
- #FB
- #GOOG
- #INTC
- #KO
- #MA
- #MCD
- #MSFT
- #NTDOY
- #PEP
- #TSLA
- #TWTR
- AUDCAD
- AUDCHF
- AUDJPY
- AUDUSD
- EURCAD
- EURCHF
- EURGBP
- EURJPY
- EURNZD
- EURRUB
- EURUSD
- GBPAUD
- GBPCHF
- GBPJPY
- GBPUSD
- GOLD
- NZDCAD
- NZDCHF
- NZDJPY
- NZDUSD
- SILVER
- USDCAD
- USDCHF
- USDJPY
- USDRUB
- All
- M5
- M15
- M30
- H1
- D1
- All
- Buy
- Sale
- All
- 1
- 2
- 3
- 4
- 5

Menurut grafik dari H1, #TSLA terbentuk Persegi Bullish. Jenis pola ini menunjukkan kelanjutan tren. Terdiri dari dua tingkat: resistance 294.59 dan support 270.55. Jika level resistance 294.59 - 294.59 ditembus
Open chart in a new window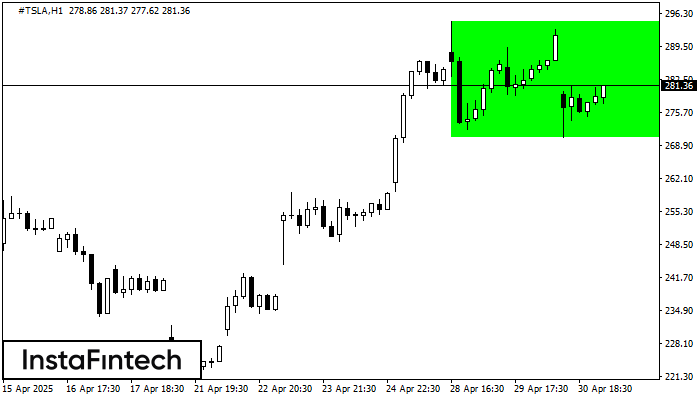
Menurut grafik dari H1, #TSLA terbentuk Persegi Bullish. Pola menunjukkan kelanjutan tren. Batas atas adalah 294.59, batas lebih rendah adalah 270.55. Sinyal berarti posisi beli harus dibuka diatas batas atas
Open chart in a new window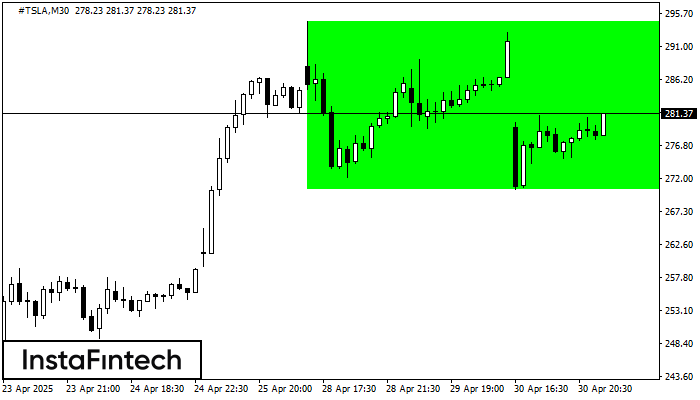
Menurut grafik dari M30, #TSLA terbentuk Persegi Bullish. Jenis pola ini menunjukkan kelanjutan tren. Terdiri dari dua tingkat: resistance 294.59 dan support 270.55. Jika level resistance 294.59 - 294.59 ditembus
Open chart in a new window