signal strength 1 of 5
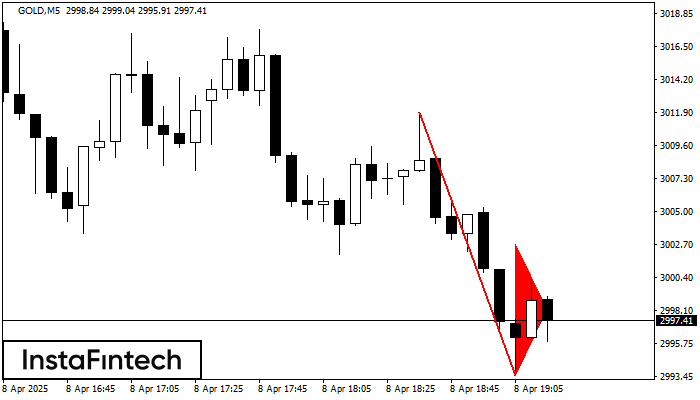
The Bearish pennant pattern has formed on the GOLD M5 chart. This pattern type is characterized by a slight slowdown after which the price will move in the direction of the original trend. In case the price fixes below the pattern’s low of 2993.55, a trader will be able to successfully enter the sell position.
The M5 and M15 time frames may have more false entry points.
See Also
- All
- Double Top
- Flag
- Head and Shoulders
- Pennant
- Rectangle
- Triangle
- Triple top
- All
- #AAPL
- #AMZN
- #Bitcoin
- #EBAY
- #FB
- #GOOG
- #INTC
- #KO
- #MA
- #MCD
- #MSFT
- #NTDOY
- #PEP
- #TSLA
- #TWTR
- AUDCAD
- AUDCHF
- AUDJPY
- AUDUSD
- EURCAD
- EURCHF
- EURGBP
- EURJPY
- EURNZD
- EURRUB
- EURUSD
- GBPAUD
- GBPCHF
- GBPJPY
- GBPUSD
- GOLD
- NZDCAD
- NZDCHF
- NZDJPY
- NZDUSD
- SILVER
- USDCAD
- USDCHF
- USDJPY
- USDRUB
- All
- M5
- M15
- M30
- H1
- D1
- All
- Buy
- Sale
- All
- 1
- 2
- 3
- 4
- 5
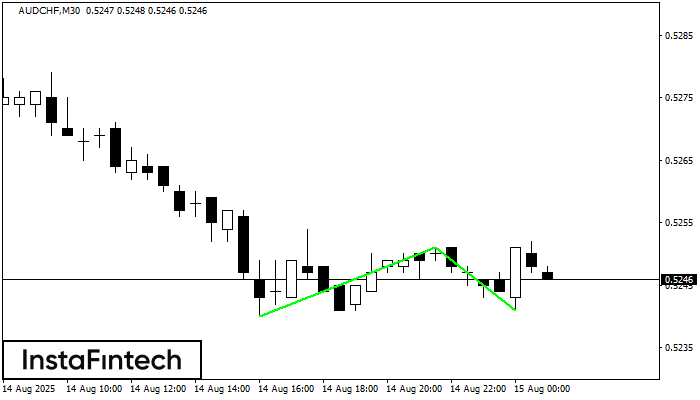
Сформирована фигура «Двойное дно» на графике AUDCHF M30. Верхняя граница 0.5251; Нижняя граница 0.5241; Ширина фигуры 11 пунктов. В случае пробоя верхней границы 0.5251 можно будет прогнозировать изменение тенденции
Открыть график инструмента в новом окне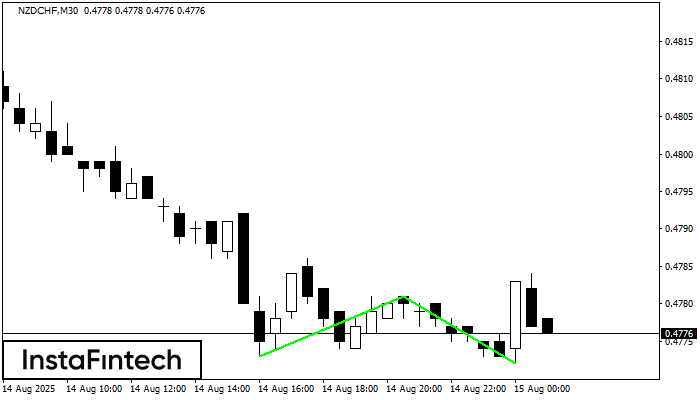
Сформирована фигура «Двойное дно» на графике NZDCHF M30. Характеристика: Уровень поддержки 0.4773; Уровень сопротивления 0.4781; Ширина фигуры 8 пунктов. В случае пробоя уровня сопротивления можно будет прогнозировать изменение тенденции
Открыть график инструмента в новом окне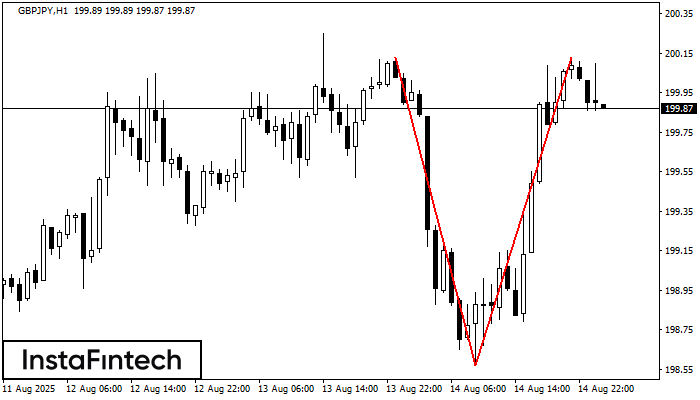
На торговом графике GBPJPY H1 сформировалась разворотная фигура «Двойная вершина». Характеристика: Верхняя граница 200.13; Нижняя граница 198.57; Ширина фигуры 156 пунктов. Сигнал: Пробой нижней границы 198.57 приведет к дальнейшему нисходящему
Открыть график инструмента в новом окне