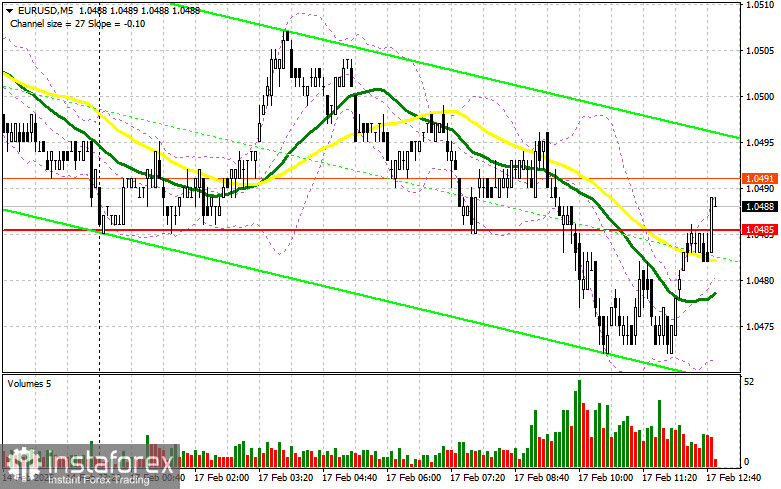
In my morning forecast, I focused on the 1.0485 level and planned to base my market entry decisions on it. Let's analyze the 5-minute chart and see what happened. The pair declined to the 1.0485 area, but no suitable entry points formed. The technical picture for the second half of the day has been revised.
To Open Long Positions on EUR/USD:
Eurozone news had little impact on the euro's dynamics, which was expected. Traders are likely focused on the Eurogroup meeting and the decisions that will follow. Additionally, there is no fundamental data scheduled for the second half of the day, so attention will shift to speeches from Federal Reserve representatives Patrick T. Harker and Michelle Bowman. Given the prevailing bullish trend, it is best to look for entry points at lower levels.
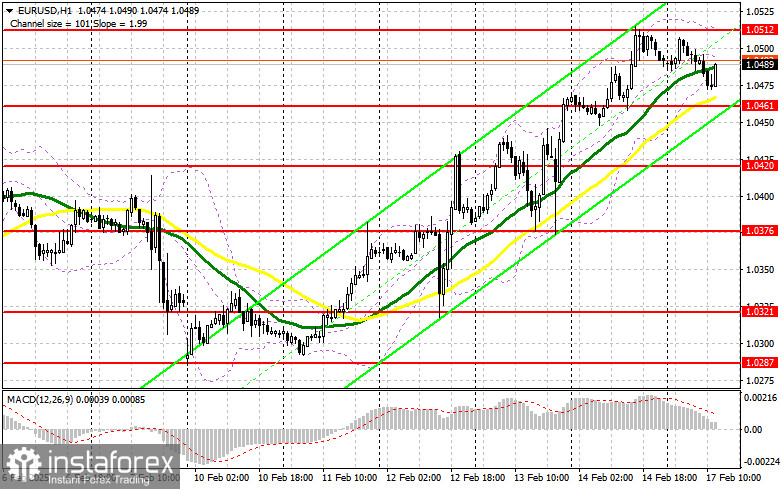
If the pair declines, I will consider entering the market after a false breakout around the new support at 1.0461, targeting a rise to the 1.0512 resistance formed in the first half of the day. A breakout and retest of this range will confirm a proper entry for buying, with a further target at 1.0554. The final target will be the 1.0593 high, where I will take profits.
If EUR/USD declines and lacks buying activity around 1.0461, euro buyers will lose momentum, and sellers may push the pair down to 1.0420. I will only consider buying after a false breakout at this level. Otherwise, I plan to enter long positions on a rebound from 1.0376, aiming for an intraday correction of 30-35 points.
To Open Short Positions on EUR/USD:
Bears attempted to gain control in the first half of the day but failed. Now, the focus is on protecting the 1.0512 resistance level—losing it will allow the bullish market to continue. To confirm their presence, sellers must ensure a false breakout at this level, which would indicate the presence of major players betting on a euro decline at the start of the week.
The target will be the 1.0461 support level, where moving averages, favoring bulls, are also located. A breakout and consolidation below this range, supported by strong U.S. data, followed by a retest from below, will provide another selling opportunity with a target at the new 1.0420 low, potentially halting the bullish market. The final target will be 1.0376, where I will take profits.
If EUR/USD rises in the second half of the day and bears do not show activity around 1.0512, which I find unlikely, buyers may push the pair even higher. In this case, I will postpone short positions until a test of the next resistance at 1.0554. I will sell there only after an unsuccessful consolidation. Otherwise, I plan to enter short positions on a rebound from 1.0593, targeting an intraday correction of 30-35 points.
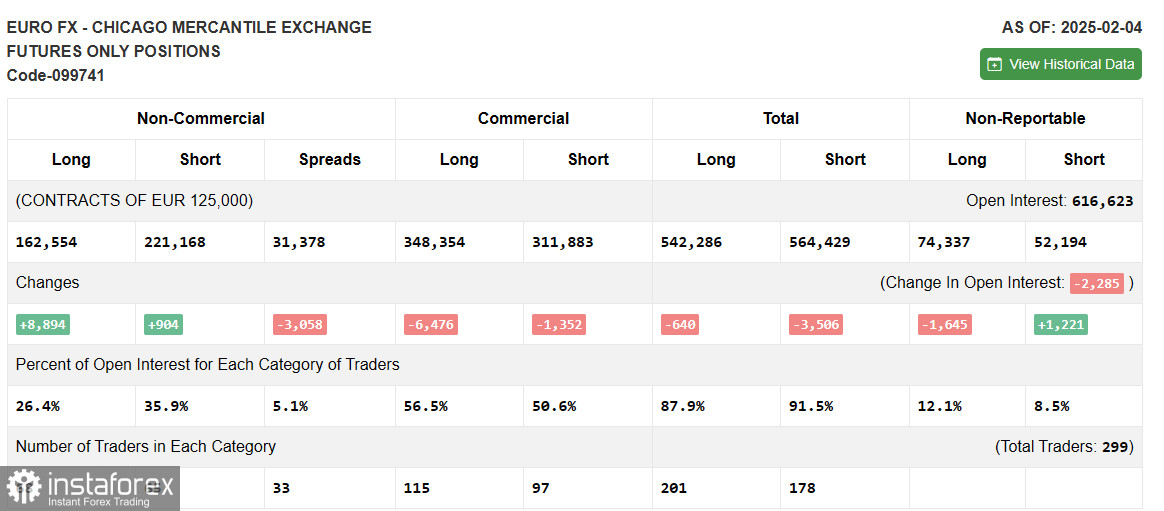
The Commitment of Traders (COT) report from February 4 showed an increase in both short and long positions. The number of euro buyers slightly increased as concerns about a more aggressive trade war under Donald Trump eased. However, these figures do not yet account for the recent strong U.S. labor market report and new tariffs on steel and aluminum, making the outlook less straightforward. It is better not to rush into buying risk assets, as the trade war is just beginning.
The COT report indicated that long non-commercial positions increased by 8,894 to 162,554, while short non-commercial positions increased by only 904 to 221,168. As a result, the gap between long and short positions narrowed by 3,058.
Indicator Signals
Moving Averages
The pair is trading above the 30- and 50-day moving averages, indicating further euro growth.
Note: The author considers the moving averages on the hourly (H1) chart, which differs from the classic daily (D1) moving averages.
Bollinger Bands
In case of a decline, the lower boundary of the indicator around 1.0480 will serve as support.
Indicator Descriptions:
- Moving Average (MA): Defines the current trend by smoothing out volatility and noise.
- 50-period MA: Marked in yellow on the chart.
- 30-period MA: Marked in green on the chart.
- MACD (Moving Average Convergence/Divergence):
- Fast EMA – 12-period
- Slow EMA – 26-period
- SMA – 9-period
- Bollinger Bands: 20-period.
- Non-Commercial Traders: Speculators such as retail traders, hedge funds, and large institutions using the futures market for speculation.
- Long Non-Commercial Positions: The total long open positions held by non-commercial traders.
- Short Non-Commercial Positions: The total short open positions held by non-commercial traders.
- Total Non-Commercial Net Position: The difference between short and long positions held by non-commercial traders.