Bitcoin continues to trade within a restricted range, and as a result, Ethereum remains in a flat market as well. Over the past few weeks, Ethereum has shown a slightly stronger inclination for growth compared to Bitcoin, likely due to the launch of new ETH-ETF instruments. However, it's important to remember that the entire crypto market follows Bitcoin's lead to some extent. If Bitcoin declines, 90% of other cryptocurrencies are likely to follow suit. Bitcoin has been targeting a downward move for some time, and this remains a key risk for Ethereum as well.
On Monday, Michael Saylor, the head of Strategy, once again reiterated his belief in Bitcoin's long-term potential and confirmed that his company would continue buying BTC regardless of price levels. While this could be interpreted as a bullish signal for both Bitcoin and altcoins, Saylor's stance is no longer a significant market-moving factor. Market participants understand that Strategy has shifted from a software company to a Bitcoin accumulation vehicle, meaning that another announcement of planned BTC purchases does not necessarily influence the broader crypto market. Consequently, this news did not trigger any positive reaction in Ethereum or Bitcoin.
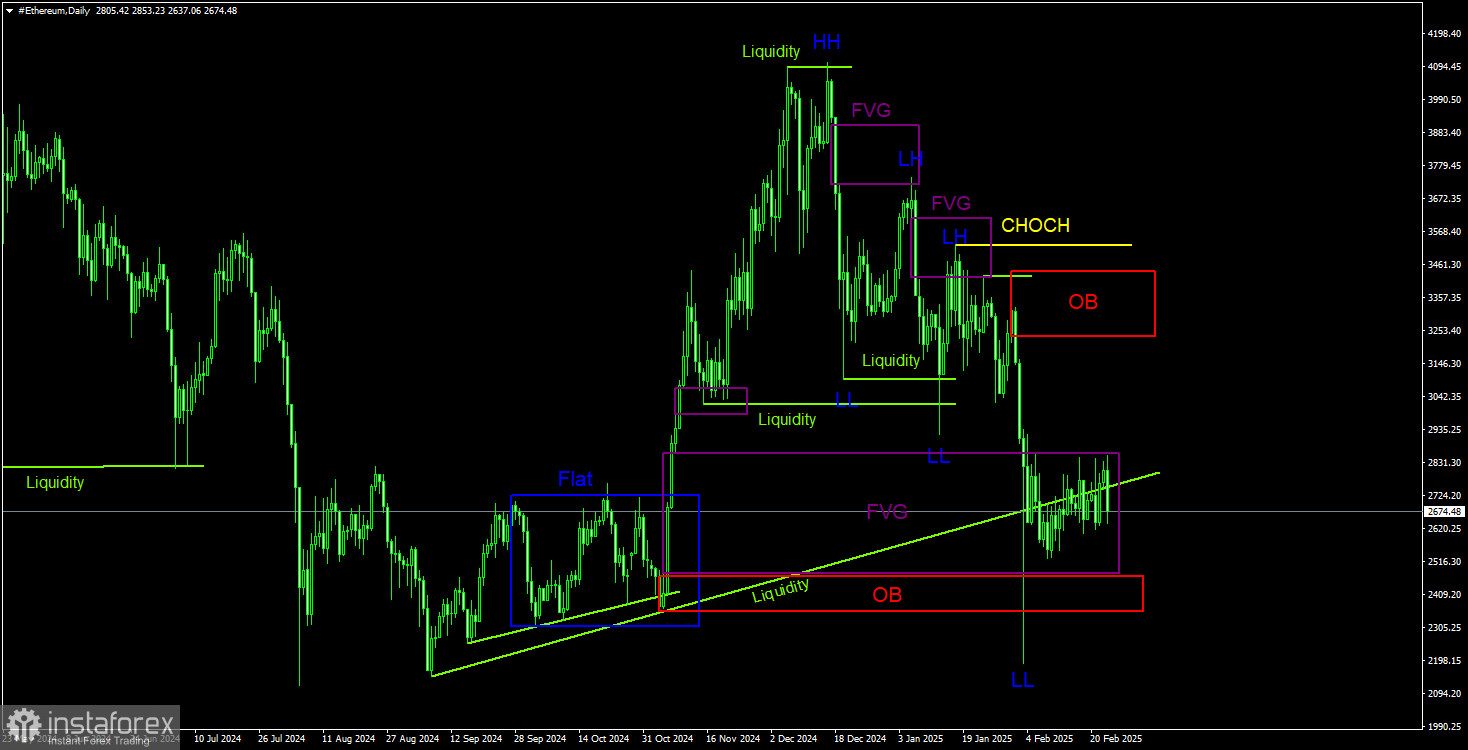
ETH/USD Daily Chart Analysis
Ethereum maintains a downtrend on the daily timeframe, while Bitcoin remains range-bound. The recent drop in Ethereum was strong enough to break through two key target zones – FVG (Fair Value Gap) and the Order Block. It is essential to note that ICT methodology works well, but altcoins remain highly correlated with Bitcoin, especially when BTC's dominance index is high, as it is now.
The bearish structure in Ethereum remains intact. The last structural high is marked at the CHOCH (Change of Character) level. If the price breaks above this level, it would indicate a potential trend reversal to the upside. However, given current market conditions, it is unlikely that Ethereum will return to $3,500 in the near future.
A further decline seems more probable, although the current flat market could delay the move. If Bitcoin breaks below its range, Ethereum is likely to experience another sharp drop. The Order Block formed on January 31 is a key area where we may see some reaction in the future. Liquidity has been gathered from two major pools, as indicated by the trend lines. Stop-loss orders were accumulated behind these levels. While Ethereum could still attempt a short-term recovery, its overall direction remains heavily dependent on Bitcoin.
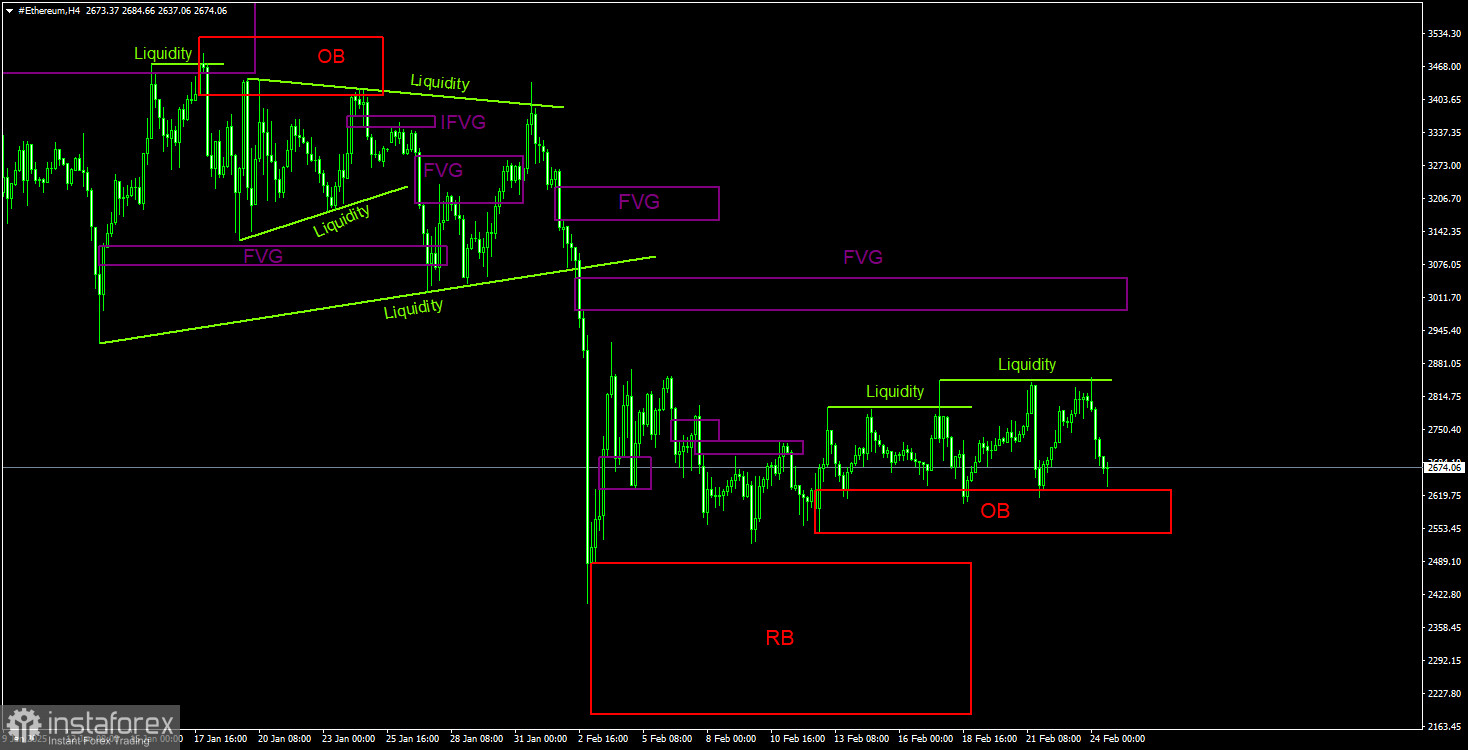
ETH/USD 4-Hour Chart Analysis
In the 4-hour timeframe, Ethereum has not shown any signs of significant recovery since its last major decline. The next major downward target is the Rejection Block, as indicated on the chart. We are highly confident that Ethereum will reach at least the midpoint of this block, but due to the current flat market, this move could take longer than expected.
The last confirmed pattern is an Order Block, which has already been tested multiple times. However, since Ethereum remains range-bound, each bounce from the Order Block has resulted in only a minor price increase. Under these conditions, the most logical approach is to focus on localized patterns and small, short-term trades.
Liquidity was recently collected from two recent highs, and Bitcoin exhibited similar movements, along with the formation of an Order Block. This suggests that both cryptocurrencies could be preparing for another major downward move.
Trading Recommendations for ETH/USD
Ethereum remains bearish, and we continue to prioritize sell setups over buy setups. So far, the altcoin market has managed to avoid a full-scale crash due to Bitcoin staying within its range. However, if BTC breaks lower and confirms a trend reversal, the entire altcoin market could experience a rapid and significant decline.
The latest liquidity sweep suggests that another drop is imminent or may have already begun. However, a liquidity sweep alone is not a sufficient trading signal, so traders should wait for additional confirmations before executing trades.
Explanation of Key Terms Used in the Charts
- CHOCH (Change of Character): A structural shift indicating a potential trend reversal.
- Liquidity: Stop-loss orders placed by traders, which market makers often target to build their own positions.
- FVG (Fair Value Gap): A zone where price moves rapidly in one direction, indicating an imbalance between buyers and sellers. Price often retraces to this zone before continuing its trend.
- IFVG (Inverted Fair Value Gap): A gap where price fails to react and instead breaks through impulsively, before retesting from the opposite side.
- OB (Order Block): The last candlestick before a strong price movement, often used by market makers to accumulate liquidity and execute large orders in the opposite direction.