


signal strength 2 of 5

The Bearish Flag pattern has been formed on the chart AUDJPY M15 which signals that the downward trend will continue. If the price breaks below the low at 90.01, then it is most likely to move further downwards. The price will likely move by the number of points which equals the length of the flag pole (15 points).
The M5 and M15 time frames may have more false entry points.
See Also
- All
- Double Top
- Flag
- Head and Shoulders
- Pennant
- Rectangle
- Triangle
- Triple top
- All
- #AAPL
- #AMZN
- #Bitcoin
- #EBAY
- #FB
- #GOOG
- #INTC
- #KO
- #MA
- #MCD
- #MSFT
- #NTDOY
- #PEP
- #TSLA
- #TWTR
- AUDCAD
- AUDCHF
- AUDJPY
- AUDUSD
- EURCAD
- EURCHF
- EURGBP
- EURJPY
- EURNZD
- EURRUB
- EURUSD
- GBPAUD
- GBPCHF
- GBPJPY
- GBPUSD
- GOLD
- NZDCAD
- NZDCHF
- NZDJPY
- NZDUSD
- SILVER
- USDCAD
- USDCHF
- USDJPY
- USDRUB
- All
- M5
- M15
- M30
- H1
- D1
- All
- Buy
- Sale
- All
- 1
- 2
- 3
- 4
- 5
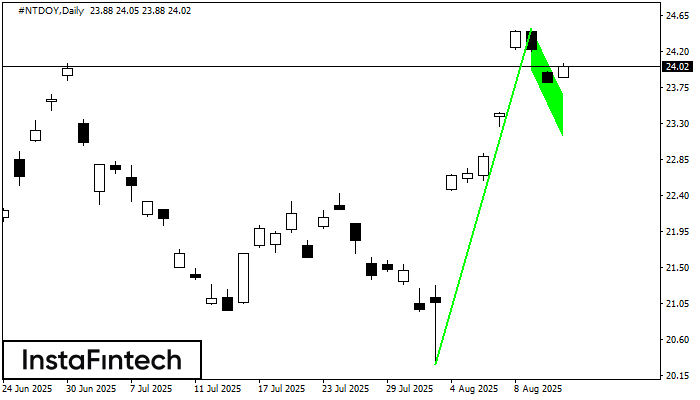
The Bullish Flag pattern which signals continuation of a trend has been formed on the chart #NTDOY D1. Forecast: if the price breaks above the pattern high at 24.49, then
Open chart in a new window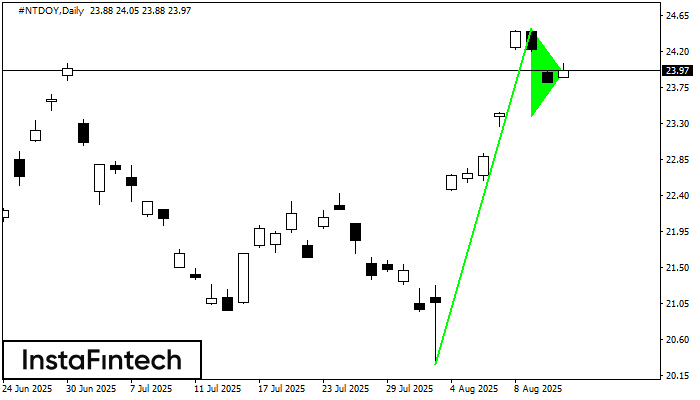
The Bullish pennant signal – Trading instrument #NTDOY D1, continuation pattern. Forecast: it is possible to set up a buy position above the pattern’s high of 24.49, with the prospect
Open chart in a new window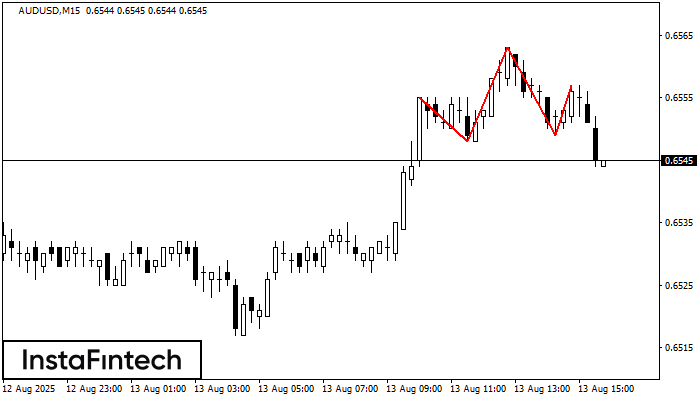
The AUDUSD M15 formed the Head and Shoulders pattern with the following features: The Head’s top is at 0.6563, the Neckline and the upward angle are at 0.6548/0.6549. The formation
The M5 and M15 time frames may have more false entry points.
Open chart in a new window


