On Monday, the GBP/USD currency pair appreciated alongside EUR/USD during the Asian trading session. It is worth noting that the German elections have no direct impact on the British pound. Therefore, seeing a sharp rise in the pound overnight on Monday was unusual. However, the British currency also gained value since the euro and the pound often moved in tandem. Nevertheless, it had returned to its starting positions by the U.S. trading session.
Despite this, the pound has shown a solid upward movement over the past one and a half to two months. Unlike the euro, which mostly appeared to be in an upward correction without indeed forming one, the British pound has established a genuine correction, which is evident even on the 4-hour chart. We believe the pound was more attractive to market participants because the Bank of England (BoE) maintains a less dovish stance than the European Central Bank (ECB). This month, it became clear that the BoE's outlook for 2025 may become even more hawkish as inflation surged sharply in January. As a result, instead of cutting rates four times this year, the BoE may only reduce them two or three times.
Meanwhile, the ECB is not planning to stop its course of monetary easing. The euro has struggled to grow, whereas the British pound has demonstrated a proper correction. However, the movements remain corrections within a five-month downtrend in both cases. The pound has been rising actively in recent weeks, but on what basis, apart from the BoE's stance? Has the UK's macroeconomic data significantly improved? No. Has the British economy started to grow after two years of stagnation? No. The pound can only credit its rise to the Bank of England and the inflation report.
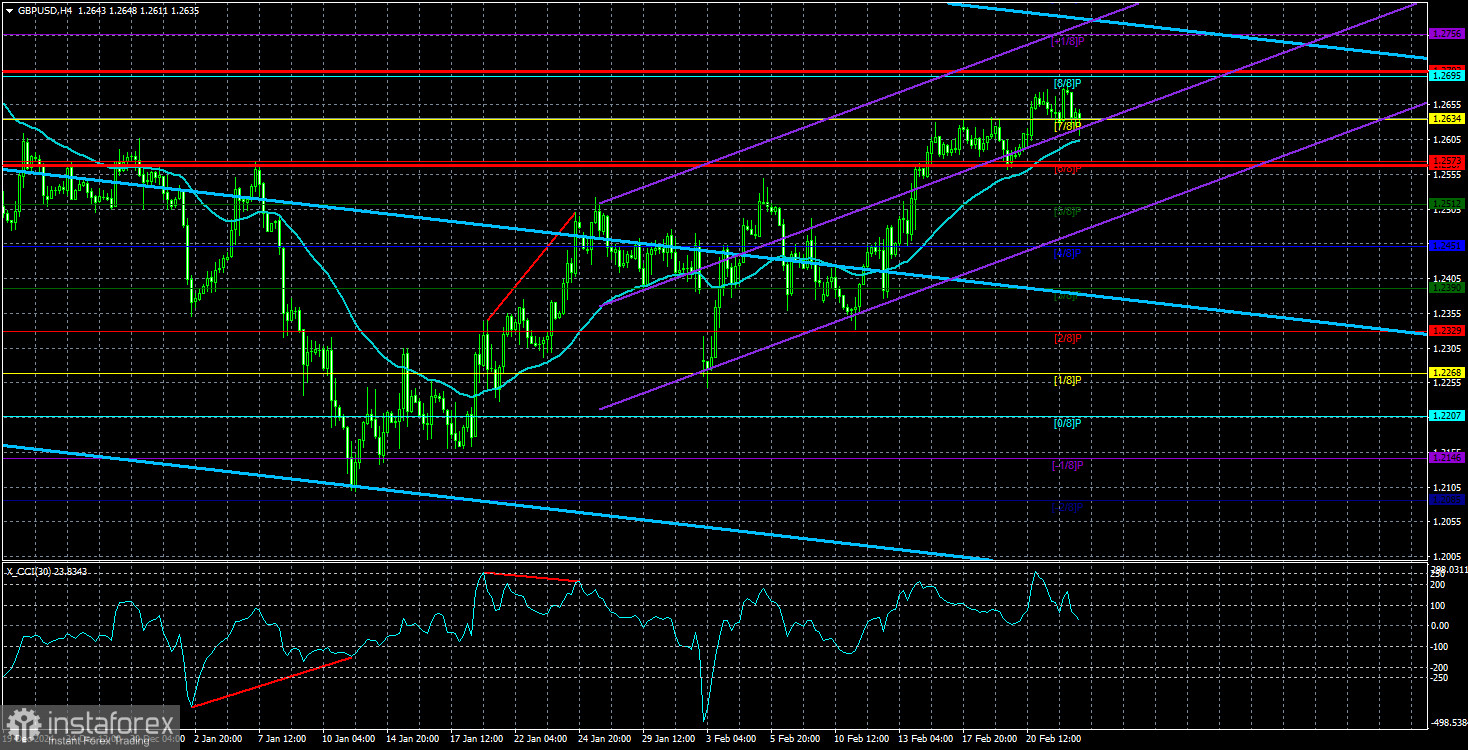
On the daily time frame, it is clear that the price has consolidated above the Senkou Span B line. This might suggest the beginning of a new uptrend, but we consider this consolidation false. We would be more inclined to consider new sell positions on the pound from the current levels, although the correction could still last for several weeks or months. The pound lacks long-term growth drivers. Perhaps Donald Trump's aggressive policies will slow down the U.S. economy and create conflicts worldwide, leading to global opposition against the U.S. However, unlike the British or European economies, the American economy continues to grow as if nothing is happening. Investors are primarily interested in returns. No matter what Trump says or whom he threatens, investors focus on the profits they can earn. As long as the U.S. economy thrives and generates profits, the dollar will remain in demand. Meanwhile, what could revive the struggling British economy remains uncertain.
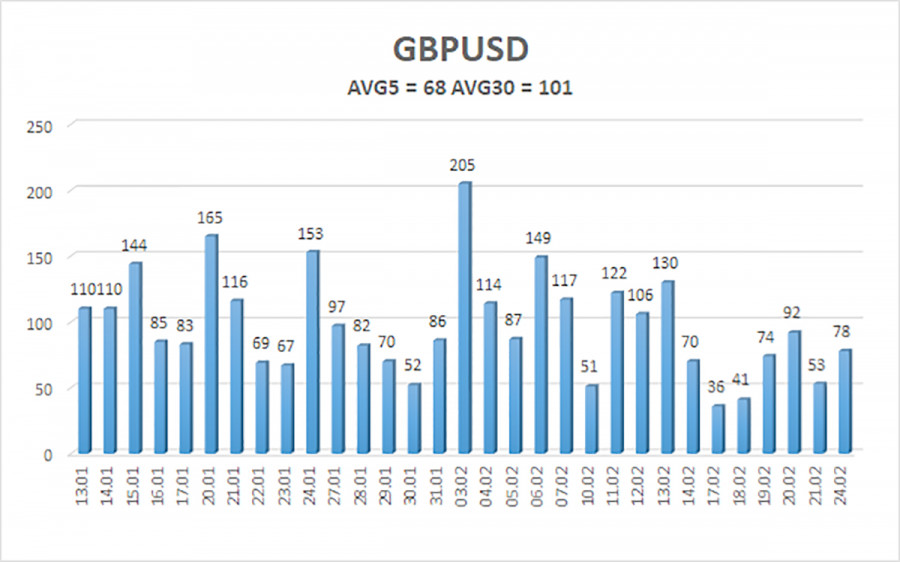
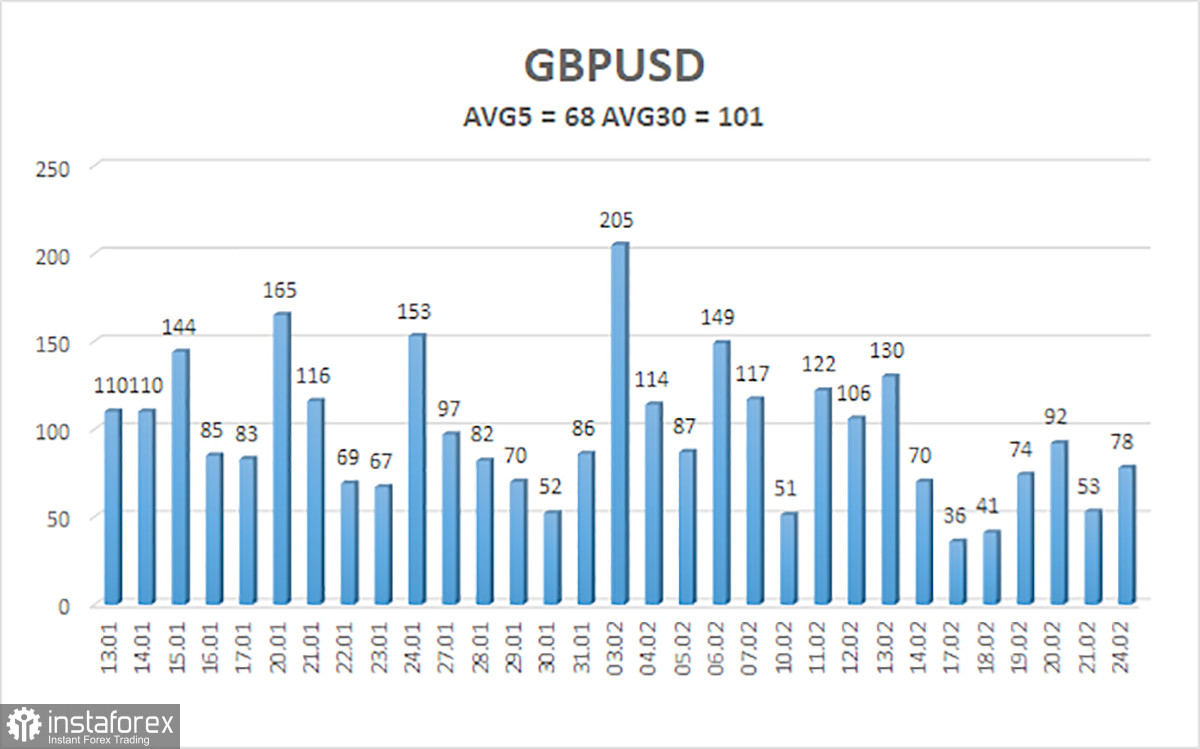
The average volatility of the GBP/USD pair over the past five trading days stands at 68 pips, which is classified as "average" for this pair. On Tuesday, February 25, we expect movement within the range of 1.2567 to 1.2703. The long-term regression channel remains downward, signaling a persistent downtrend. The CCI indicator entered the overbought zone on Friday, likely suggesting an impending decline.
Nearest Support Levels:
S1 – 1.2634
S2 – 1.2573
S3 – 1.2512
Nearest Resistance Levels:
R1 – 1.2695
R2 – 1.2756
R3 – 1.2817
Trading Recommendations:
The GBP/USD pair maintains a medium-term downtrend. We still do not consider long positions, as we believe the current upward movement is merely a correction. If you trade purely on technical analysis, long positions are possible, with targets at 1.2695 and 1.2756 if the price remains above the moving average. However, short positions remain far more relevant, with targets at 1.2207 and 1.2146, since the upward correction on the daily time frame will eventually end. For short positions, at the very least, a consolidation below the moving average is required. Ideally, shorts should be opened at the end of the correction on the daily time frame, but predicting exactly when it will end is difficult.
Explanation of Illustrations:
Linear Regression Channels help determine the current trend. If both channels are aligned, it indicates a strong trend.
Moving Average Line (settings: 20,0, smoothed) defines the short-term trend and guides the trading direction.
Murray Levels act as target levels for movements and corrections.
Volatility Levels (red lines) represent the likely price range for the pair over the next 24 hours based on current volatility readings.
CCI Indicator: If it enters the oversold region (below -250) or overbought region (above +250), it signals an impending trend reversal in the opposite direction.